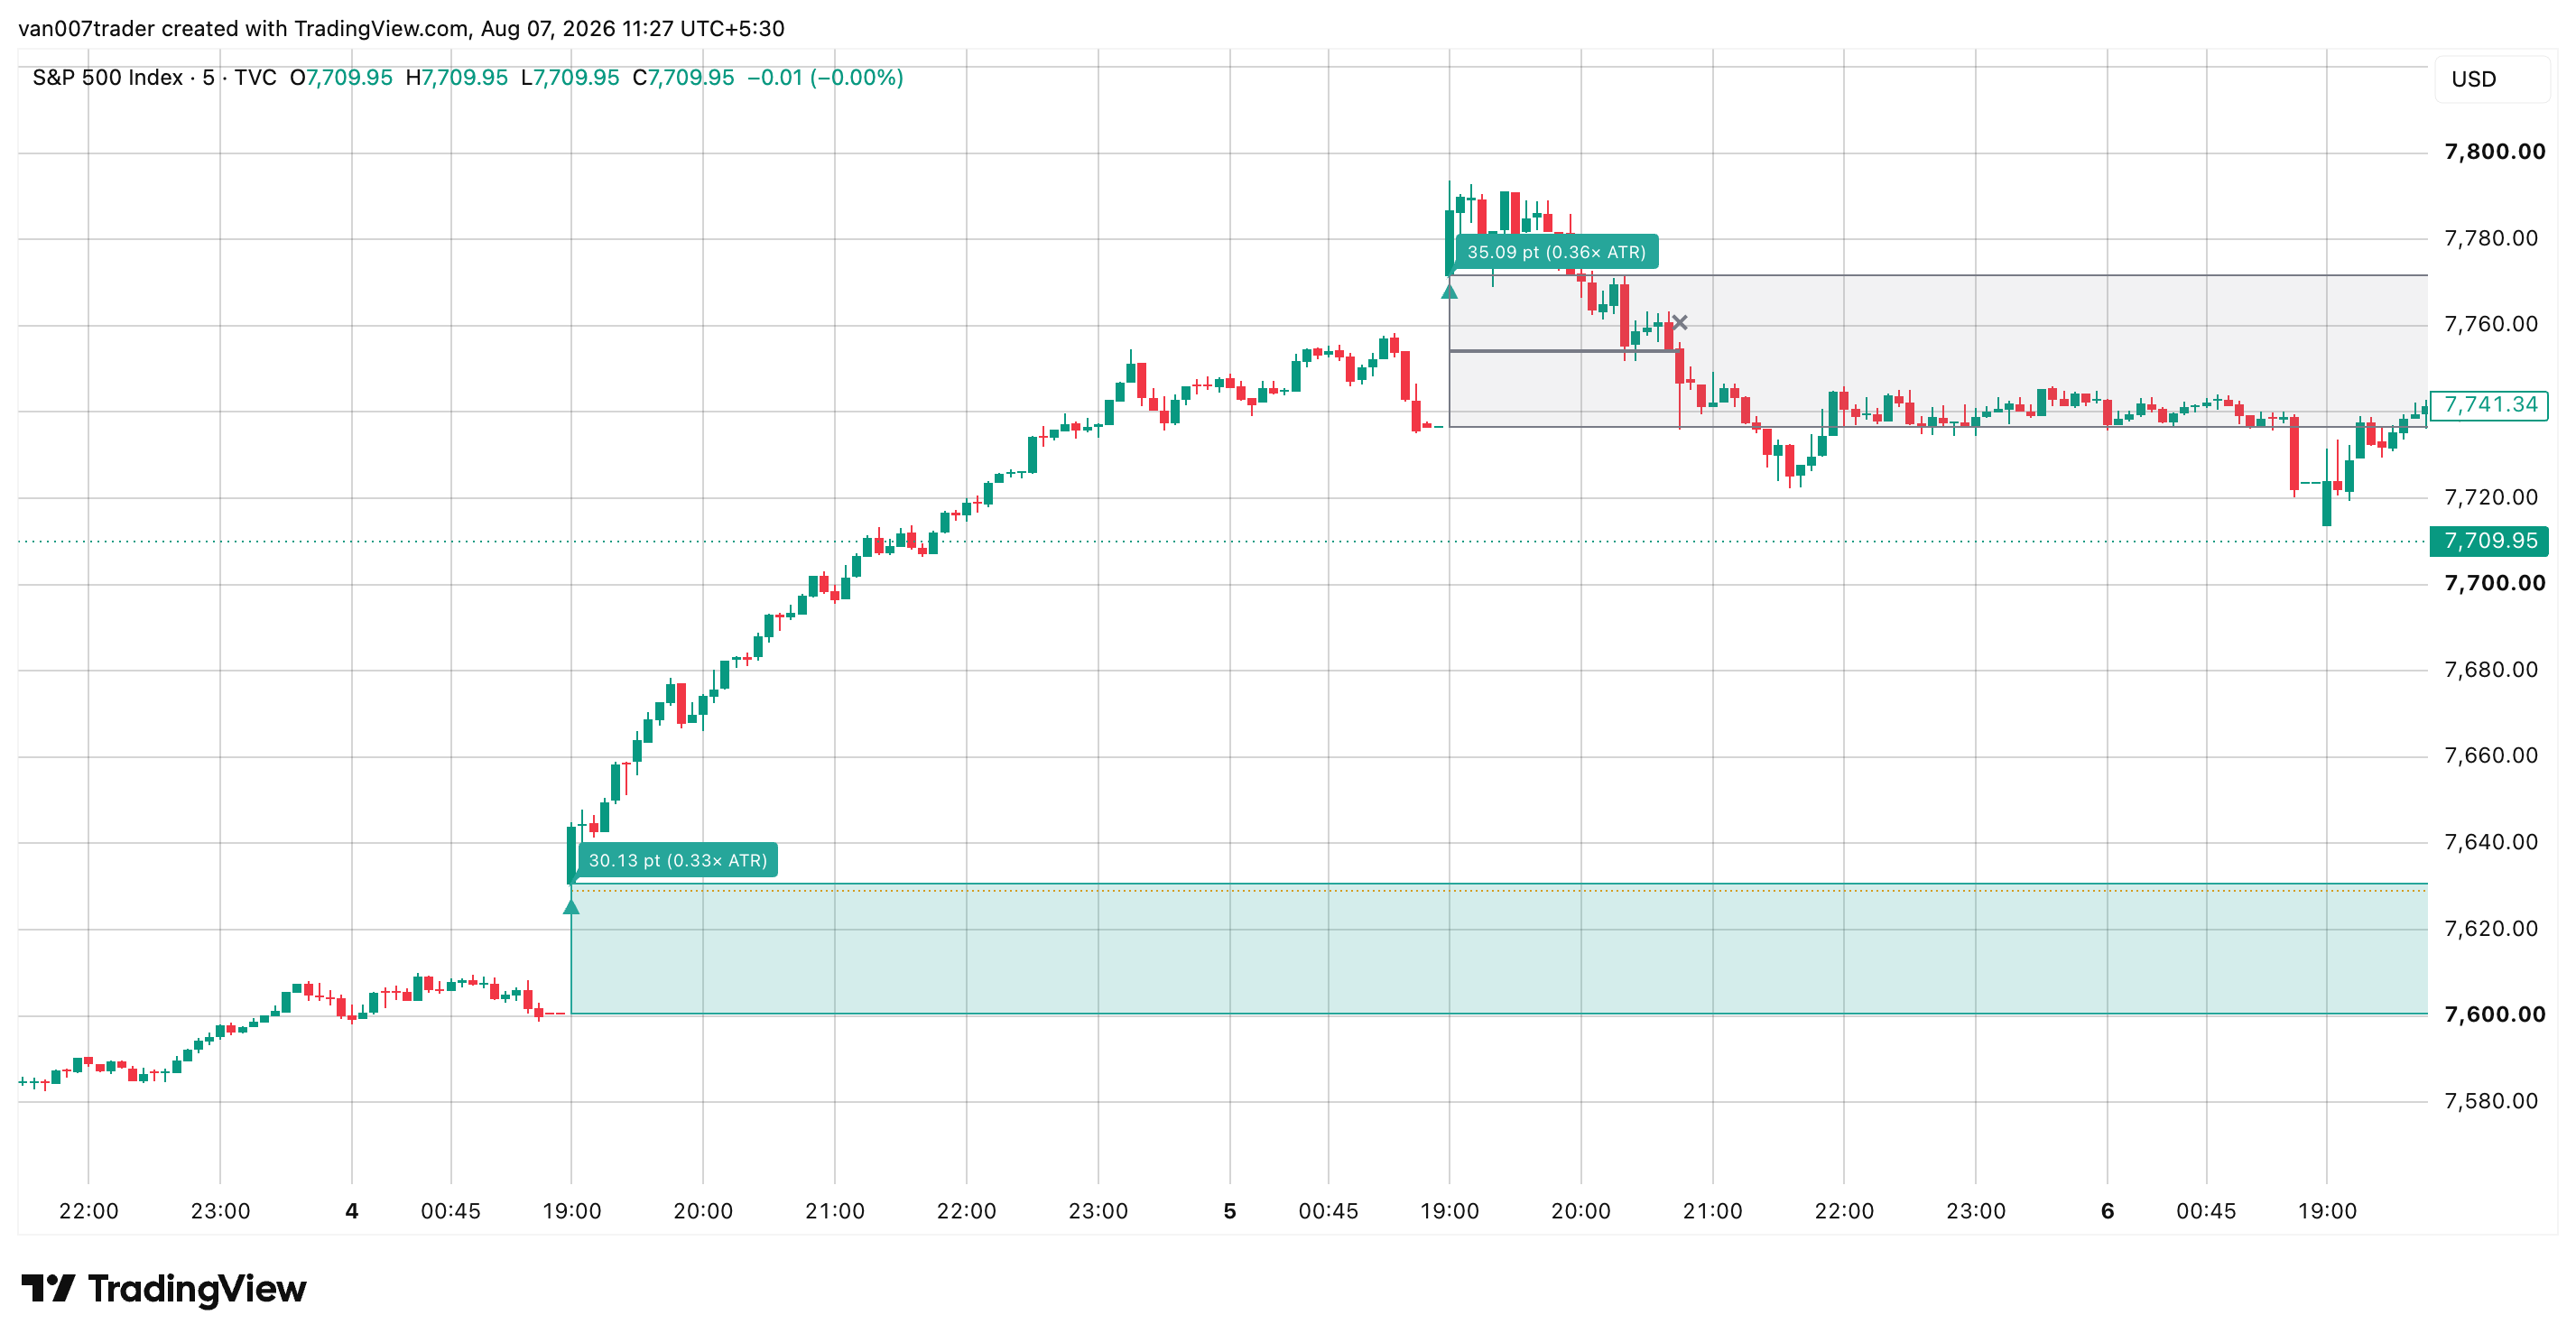
Gap Detector finds the price gaps that form between trading sessions and tracks them visually on the chart from formation through fill. Every time a new session opens away from the previous session's close — by more than a configurable fraction of the daily ATR — the indicator drops a shaded rectangle covering the gap zone, color-coded green for an up-gap and red for a down-gap. The box stays on the chart, extending bar by bar, until price trades back through the prior close and fills it. When that happens, the box turns gray, a strikethrough line is drawn through the middle, and a fill alert fires.
The threshold is ATR-relative, not a fixed point amount, so the same default settings work across instruments with very different price scales. Stocks, indices, forex pairs, commodities, and crypto all use the same `0.5x daily ATR` filter — the indicator scales itself. Up to N gaps (configurable) are kept on the chart at once, with optional fill-progress lines that show how close each open gap has come to filling.
Key Features
- ATR-Relative Threshold — Minimum gap size is expressed as a multiple of the 14-period daily ATR, so the same setting filters appropriately on a $50 stock and a $5,000 index.
- Color-Coded Gap Boxes — Green for gap-up, red for gap-down, gray for filled. The box always spans from the prior session close to the new session open.
- Fill-Progress Tracking — A dotted line inside each open gap marks the deepest price has penetrated so far. Lets you see at a glance how close a gap is to filling.
- Strikethrough on Fill — When price fully retraces back through the prior close, the box recolors and a horizontal line is drawn through it — visual confirmation the gap is closed.
- Configurable On-Chart History — Cap the number of gap boxes shown so the chart stays clean. Optionally hide filled gaps entirely if you only want live structure.
- Gap Size Labels — Each gap shows its size in points and as a multiple of the daily ATR — you can rank gaps by relative magnitude without doing the math.
- No Repainting — Gap detection runs only on confirmed bars. Once a box is drawn it never relocates; it only extends rightward and recolors when filled.
How It Works
At the open of each new session, the indicator compares the session's first-bar open to the previous session's last-bar close. If the absolute difference exceeds the configured `ATR multiplier x daily ATR` threshold, a new gap is registered. A shaded rectangle is drawn between the prior close and the new open — green if the open is above (gap up), red if below (gap down). A small label on the box reports the gap's size in points and as a multiple of the daily ATR.
From the formation bar onward, every subsequent bar is checked against the prior close. For a gap up, the gap fills the moment any bar's low touches or crosses below the prior close. For a gap down, it fills when any bar's high touches or crosses above the prior close. While the gap remains open, a dotted "fill progress" line is updated to sit at the deepest penetration so far — the closer that line is to the prior close, the closer the gap is to filling.
When a gap fills, the box's fill and border recolor to gray, a horizontal strikethrough line is drawn through the middle of the box, and a fill alert fires. If the "Keep Filled Gaps Visible" toggle is off, the gap is removed from the chart instead. Either way, the count of on-chart gaps respects the `Max Gaps to Show` cap — the oldest gap (filled or not) is removed when the limit is reached, so the indicator never crowds the chart.
The daily ATR used for the threshold is fetched with non-lookahead higher-timeframe security calls, so the threshold at the open of session N is sized using only data available through session N-1. There is no peeking ahead.
Settings
Min Gap Size (x Daily ATR) (default: 0.5) is the minimum gap size to qualify, expressed as a multiple of the 14-period daily ATR. Lower captures more, smaller gaps; higher filters down to large opening shocks. Set to 0 to flag every nonzero gap. Daily ATR Length (default: 14) is the lookback for the daily ATR — 14 is the Wilder standard.
Max Gaps to Show (default: 5) caps the number of gap boxes (open and filled) kept on the chart at once. When the cap is hit, the oldest box is removed. Keep Filled Gaps Visible (default: on) controls whether filled gaps stay on the chart with a strikethrough or are removed the moment they fill.
Visual toggles independently control the fill-progress line, the gap-size label, and the colors used for gap-up, gap-down, and filled boxes. Box Transparency (default: 80) sets how see-through the box fills are; filled-gap boxes use a slightly higher transparency so they recede into the background. The two alert toggles enable or disable the new-gap and gap-filled alerts individually.
Alerts
- New Gap Up — Fires on the formation bar of a qualifying gap UP. "Gap Detector [DYNA]: A new bullish session gap UP has formed above the configured ATR threshold."
- New Gap Down — Fires on the formation bar of a qualifying gap DOWN. "Gap Detector [DYNA]: A new bearish session gap DOWN has formed above the configured ATR threshold."
- Gap Up Filled — Fires when an open gap UP fills. "Gap Detector [DYNA]: A bullish gap UP has been fully filled — price traded back down to the prior session close."
- Gap Down Filled — Fires when an open gap DOWN fills. "Gap Detector [DYNA]: A bearish gap DOWN has been fully filled — price traded back up to the prior session close."
To set up alerts: click TradingView's Alerts button, choose "Gap Detector [DYNA]" from the condition dropdown, pick the gap event you want, and select your notification channel.
Best Practices
- Use the daily timeframe for the cleanest gap-by-gap reading. Drop to intraday timeframes (15m through 60m) when you want to watch a specific gap fill in real time during the session that's reacting to it.
- Tune the ATR multiplier to your style: 0.2-0.3 for stocks with small absolute gaps, 0.5 for the default moderate filter, 0.8-1.0 for only large opening shocks.
- The prior close (the far edge of the gap) is a natural reference level — many traders watch it as a potential target when studying gap behavior. Use it as a level of interest if you're observing how a gap reacts.
- The new session open (the near edge) often acts as the first support/resistance test. Use it as your structure for entries and stops.
- If a gap doesn't fill for several sessions, you can study it as a structural reference — a support/resistance level worth watching until price tests it again.
- Reduce Max Gaps to Show to 3 on instruments that gap often (single-name stocks). Increase to 10-20 on instruments that gap rarely (FX majors).
Part of the DYNA Ecosystem
Gap Detector is a free indicator built with the same design standards as the DYNA premium suite. For complete trade management with automatic stop loss, break-even, trailing stops, and multi-target systems, explore the full DYNA indicator collection.
Disclaimer
This indicator is a technical analysis and educational tool only — it is not financial advice and makes no guarantee of any outcome. Past gap behavior does not predict future results. Always do your own research and use proper position sizing and risk management.