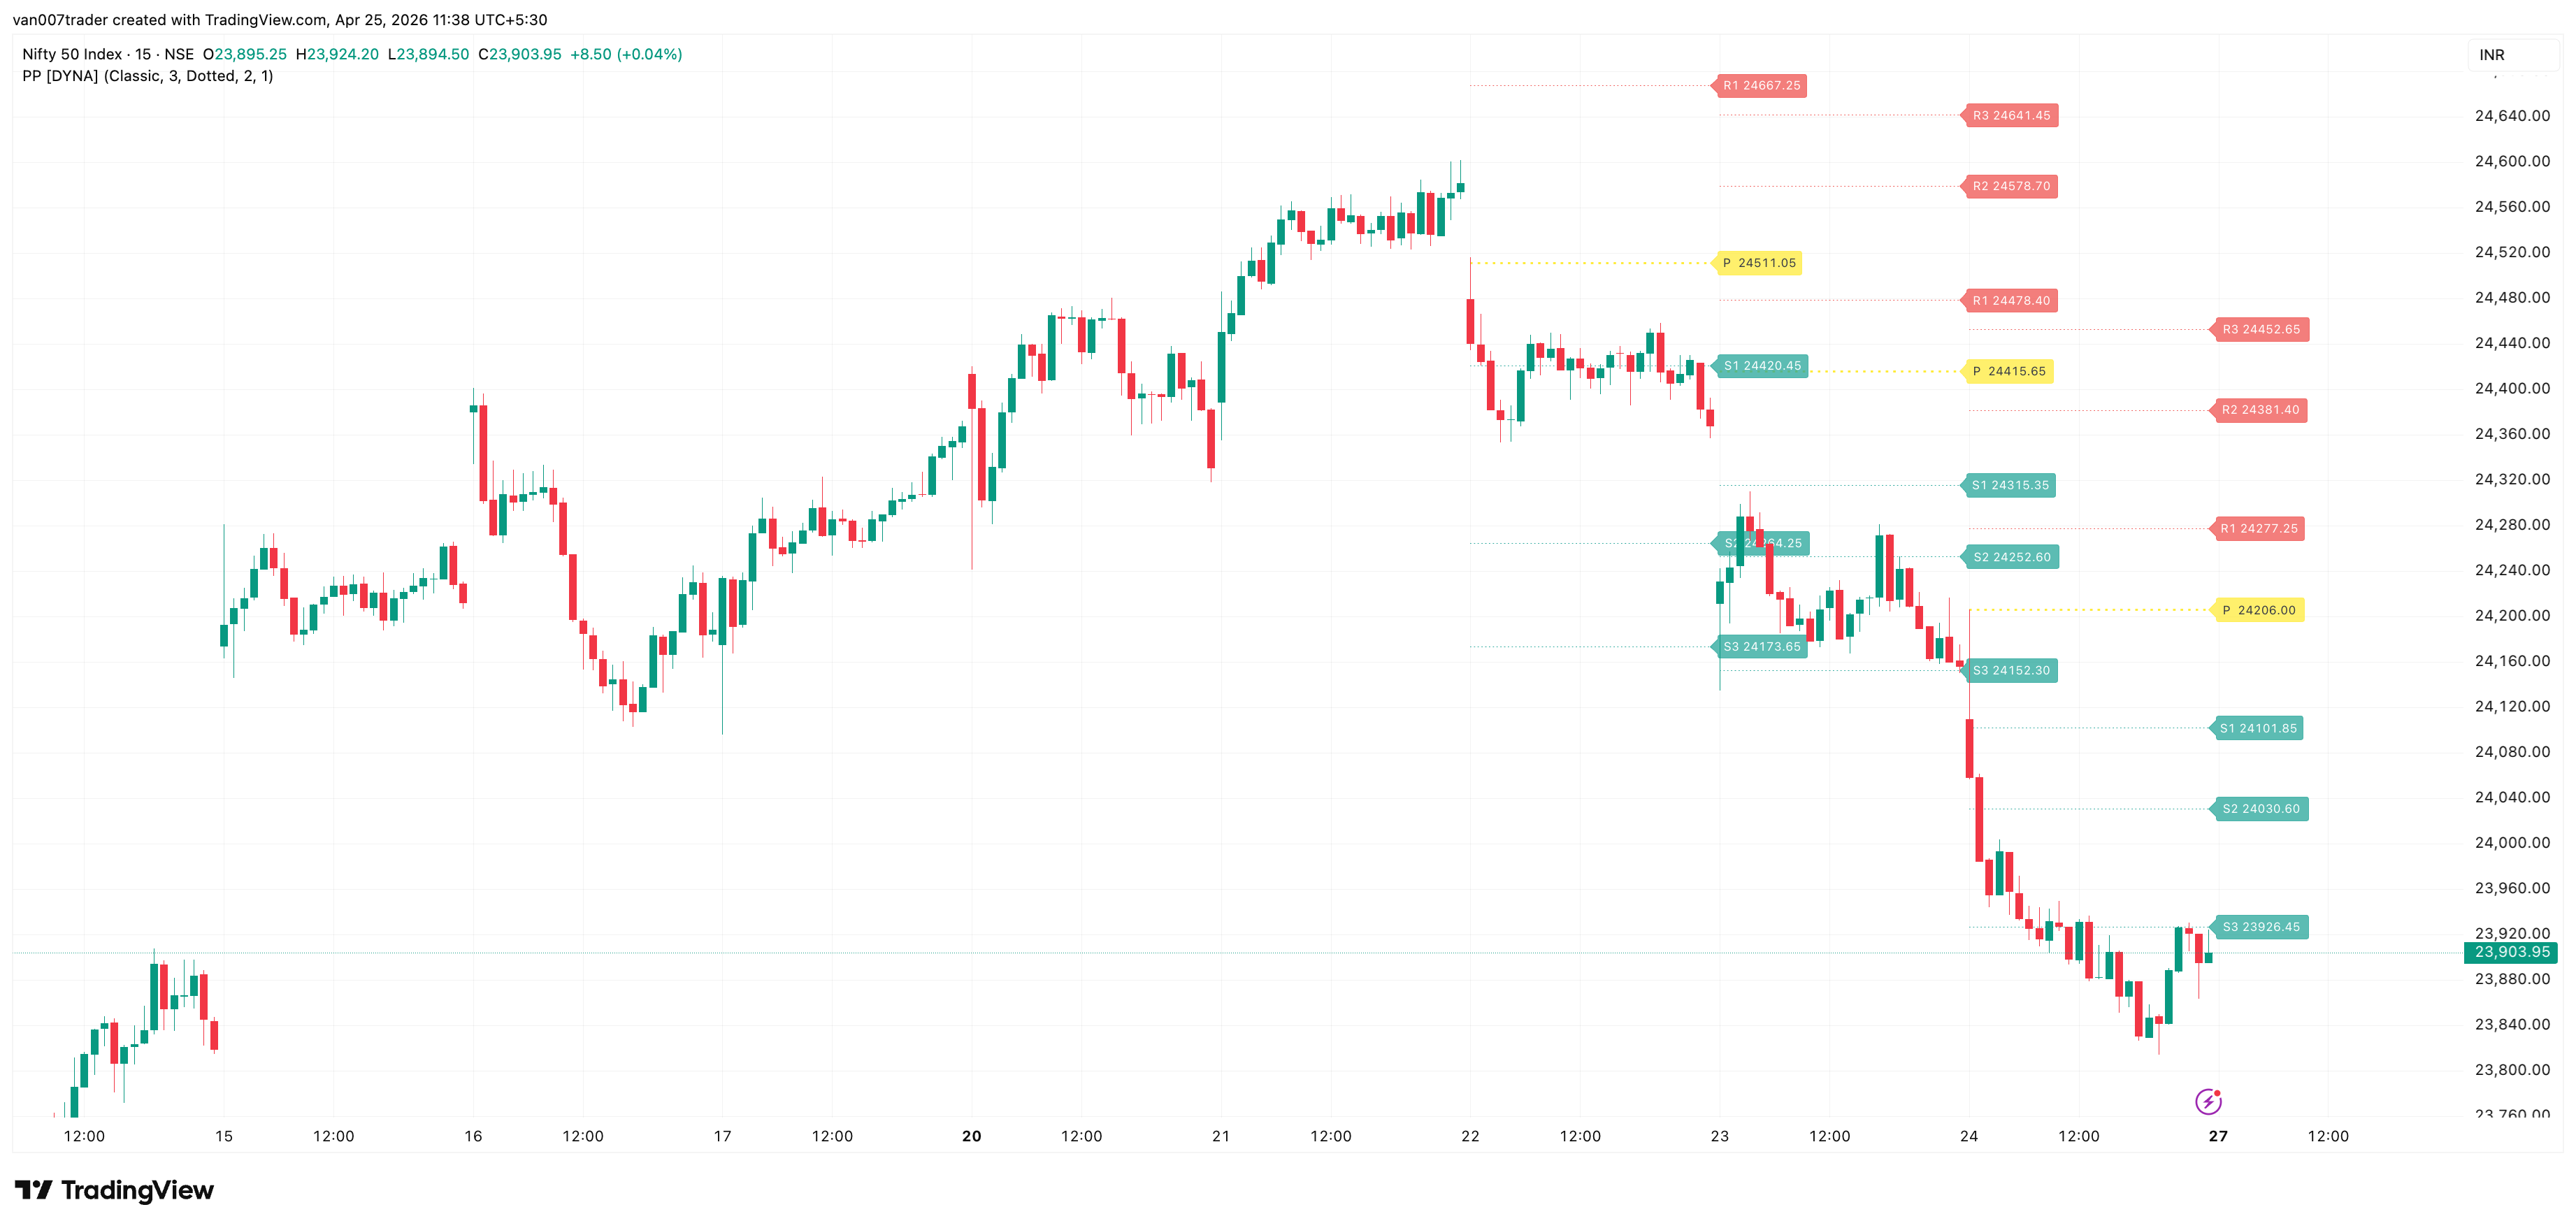
Intraday Pivot Points draws a fresh set of horizontal price levels at the start of every trading day, calculated entirely from the previous day's high, low, and close. The central pivot anchors the day's bias — price above it skews bullish, below it skews bearish — and three resistance levels (R1, R2, R3) plus three support levels (S1, S2, S3) frame the typical and extreme intraday targets. Levels are computed once at session open and stay fixed all day, which makes them clean structural reference points that never repaint or shift mid-session.
Four pivot methods are built in. Classic uses the original floor-trader formula. Fibonacci offsets the levels at 38.2%, 61.8%, and 100% of yesterday's range. Woodie applies a close-weighted pivot. Camarilla produces tighter close-anchored levels often used for mean-reversion. Switch between them with one dropdown — the rest of the indicator works the same.
Key Features
- Four Pivot Methods — Classic, Fibonacci, Woodie, Camarilla. Pick the one that matches your style: wider levels for breakouts, tighter Camarilla levels for fades.
- Pivot + 6 Levels — Central pivot plus R1/R2/R3 above and S1/S2/S3 below. Each level can be toggled independently to keep the chart clean.
- Auto-Reset Each Session — Lines are drawn fresh at the start of every new trading day from the previous day's HLC. Default view shows only today's levels for a clean chart; raise the history limit (up to 50 sessions) when you want to study past days.
- Live Right-Edge Labels — Every visible level carries a price tag that tracks the latest bar so the level name and exact price stay visible at the edge of the chart.
- Configurable Visuals — Choose line style (solid, dashed, dotted), width for pivot vs. S/R, and toggle each level. Pivot defaults to thicker than S/R for emphasis.
- One-Shot Alerts — Pivot cross (bullish or bearish), R2 reached, S2 reached. Each alert latches per session, so you get one clean signal per direction per day — no spam from re-crosses.
- No Repainting — Yesterday's HLC is fetched with the canonical lookahead-on + bar-offset pattern. Levels stay constant throughout the session and never reference future data.
How It Works
At the start of each trading day, the indicator pulls the previous completed daily bar's high, low, and close from the chart's symbol via request.security. Those three numbers feed the chosen method's formula to produce the pivot and the six S/R levels. The levels are drawn as horizontal lines with the pivot rendered thicker by default, and a price-tag label is placed at the right edge of each visible line.
As new intraday bars arrive, the indicator extends the right edge of today's lines forward so they always reach the latest bar. When a new trading day begins, today's lines freeze at their final right-edge position and a new set of lines is created. Past sessions remain visible up to the Max Sessions to Keep limit, then are deleted automatically to stay within TradingView's drawing budget.
Three alert conditions watch for the most actionable level interactions. The first close that crosses the central pivot in either direction fires the pivot-cross alert (bullish above, bearish below). The first close at or above R2 fires the R2-reached alert; the first close at or below S2 fires the S2-reached alert. Each alert latches when it fires and resets only at the start of the next day, so you cannot get a flood of repeat triggers from price oscillating around a level.
Settings
Pivot Method (default: Classic) selects the formula. Classic is the universal default and the widest typical-range method. Fibonacci uses 38.2%/61.8%/100% range offsets which sit between Classic and Camarilla in tightness. Woodie applies a close-weighted pivot that biases the central level toward the previous close; the S/R offsets are the same as Classic. Camarilla produces close-anchored levels with a 1.1× scaling factor and is significantly tighter than the others — often used for mean-reversion fades inside the day's range.
Max Sessions to Keep (default: 1) limits how many trading sessions of pivot lines stay on the chart. The default of 1 shows only today's pivots, which is the cleanest live-trading view — consecutive days often have overlapping S/R prices and stacking three or more days of labels can clutter the chart. Raise to 5-10 to study how price has been respecting recent days' levels, or up to 50 for a long historical record.
The visual section toggles each level independently (Show R1 through Show R3, Show S1 through Show S3, Show Price Labels). Line Style (Solid / Dashed / Dotted) and the two width inputs (Pivot Line Width, S/R Line Width) control appearance. The three alert toggles enable or disable the pivot-cross, R2-reach, and S2-reach alerts individually.
Alerts
- Bullish Pivot Cross — Fires on the first close above the central pivot in a session. "Intraday Pivot Points [DYNA]: Price crossed above the central pivot."
- Bearish Pivot Cross — Fires on the first close below the central pivot in a session. "Intraday Pivot Points [DYNA]: Price crossed below the central pivot."
- R2 Reached — Fires on the first close at or above R2 in a session. "Intraday Pivot Points [DYNA]: Price reached R2 — extreme upside target."
- S2 Reached — Fires on the first close at or below S2 in a session. "Intraday Pivot Points [DYNA]: Price reached S2 — extreme downside target."
To configure: open TradingView's Alerts panel, choose "Intraday Pivot Points [DYNA]" from the condition dropdown, pick the desired alert type, and select your notification channel.
Best Practices
- Use intraday timeframes (1m, 5m, 15m, 1h). Pivot points are a daily-anchored intraday tool; on daily charts each bar shows its own pivots which is rarely useful.
- Match the method to the regime. On wide-range trending days Classic and Woodie give the most usable structure. On tight-range chop, Camarilla's narrower levels produce cleaner fade entries.
- Watch the pivot first, the S/R levels second. The single most important level on any session is whether price holds above or below the central pivot. R/S are secondary.
- Look for confluence. A pivot level that aligns with a moving average, VWAP, or a previous-day swing is much more reliable than the level on its own.
- R2/S2 reaches tend to be relatively uncommon on Classic pivots. When price does reach them, the move is already extended — many traders treat that as a spot to study for a fade rather than a chase.
- Default Max Sessions to Keep is 1 (only today's pivots) — the cleanest view for live trading. Raise to 5-10 to back-study recent prior pivots, or up to 50 for long historical context.
Part of the DYNA Ecosystem
Intraday Pivot Points is a free indicator built with the same design standards as the DYNA premium suite. For complete trade management with automatic stop loss, break-even, trailing stops, and multi-target systems, explore the full DYNA indicator collection.
Disclaimer
This indicator is a technical analysis and educational tool only — it is not financial advice and makes no guarantee of any outcome. Past performance does not predict future results. Always do your own research and use proper position sizing and risk management.