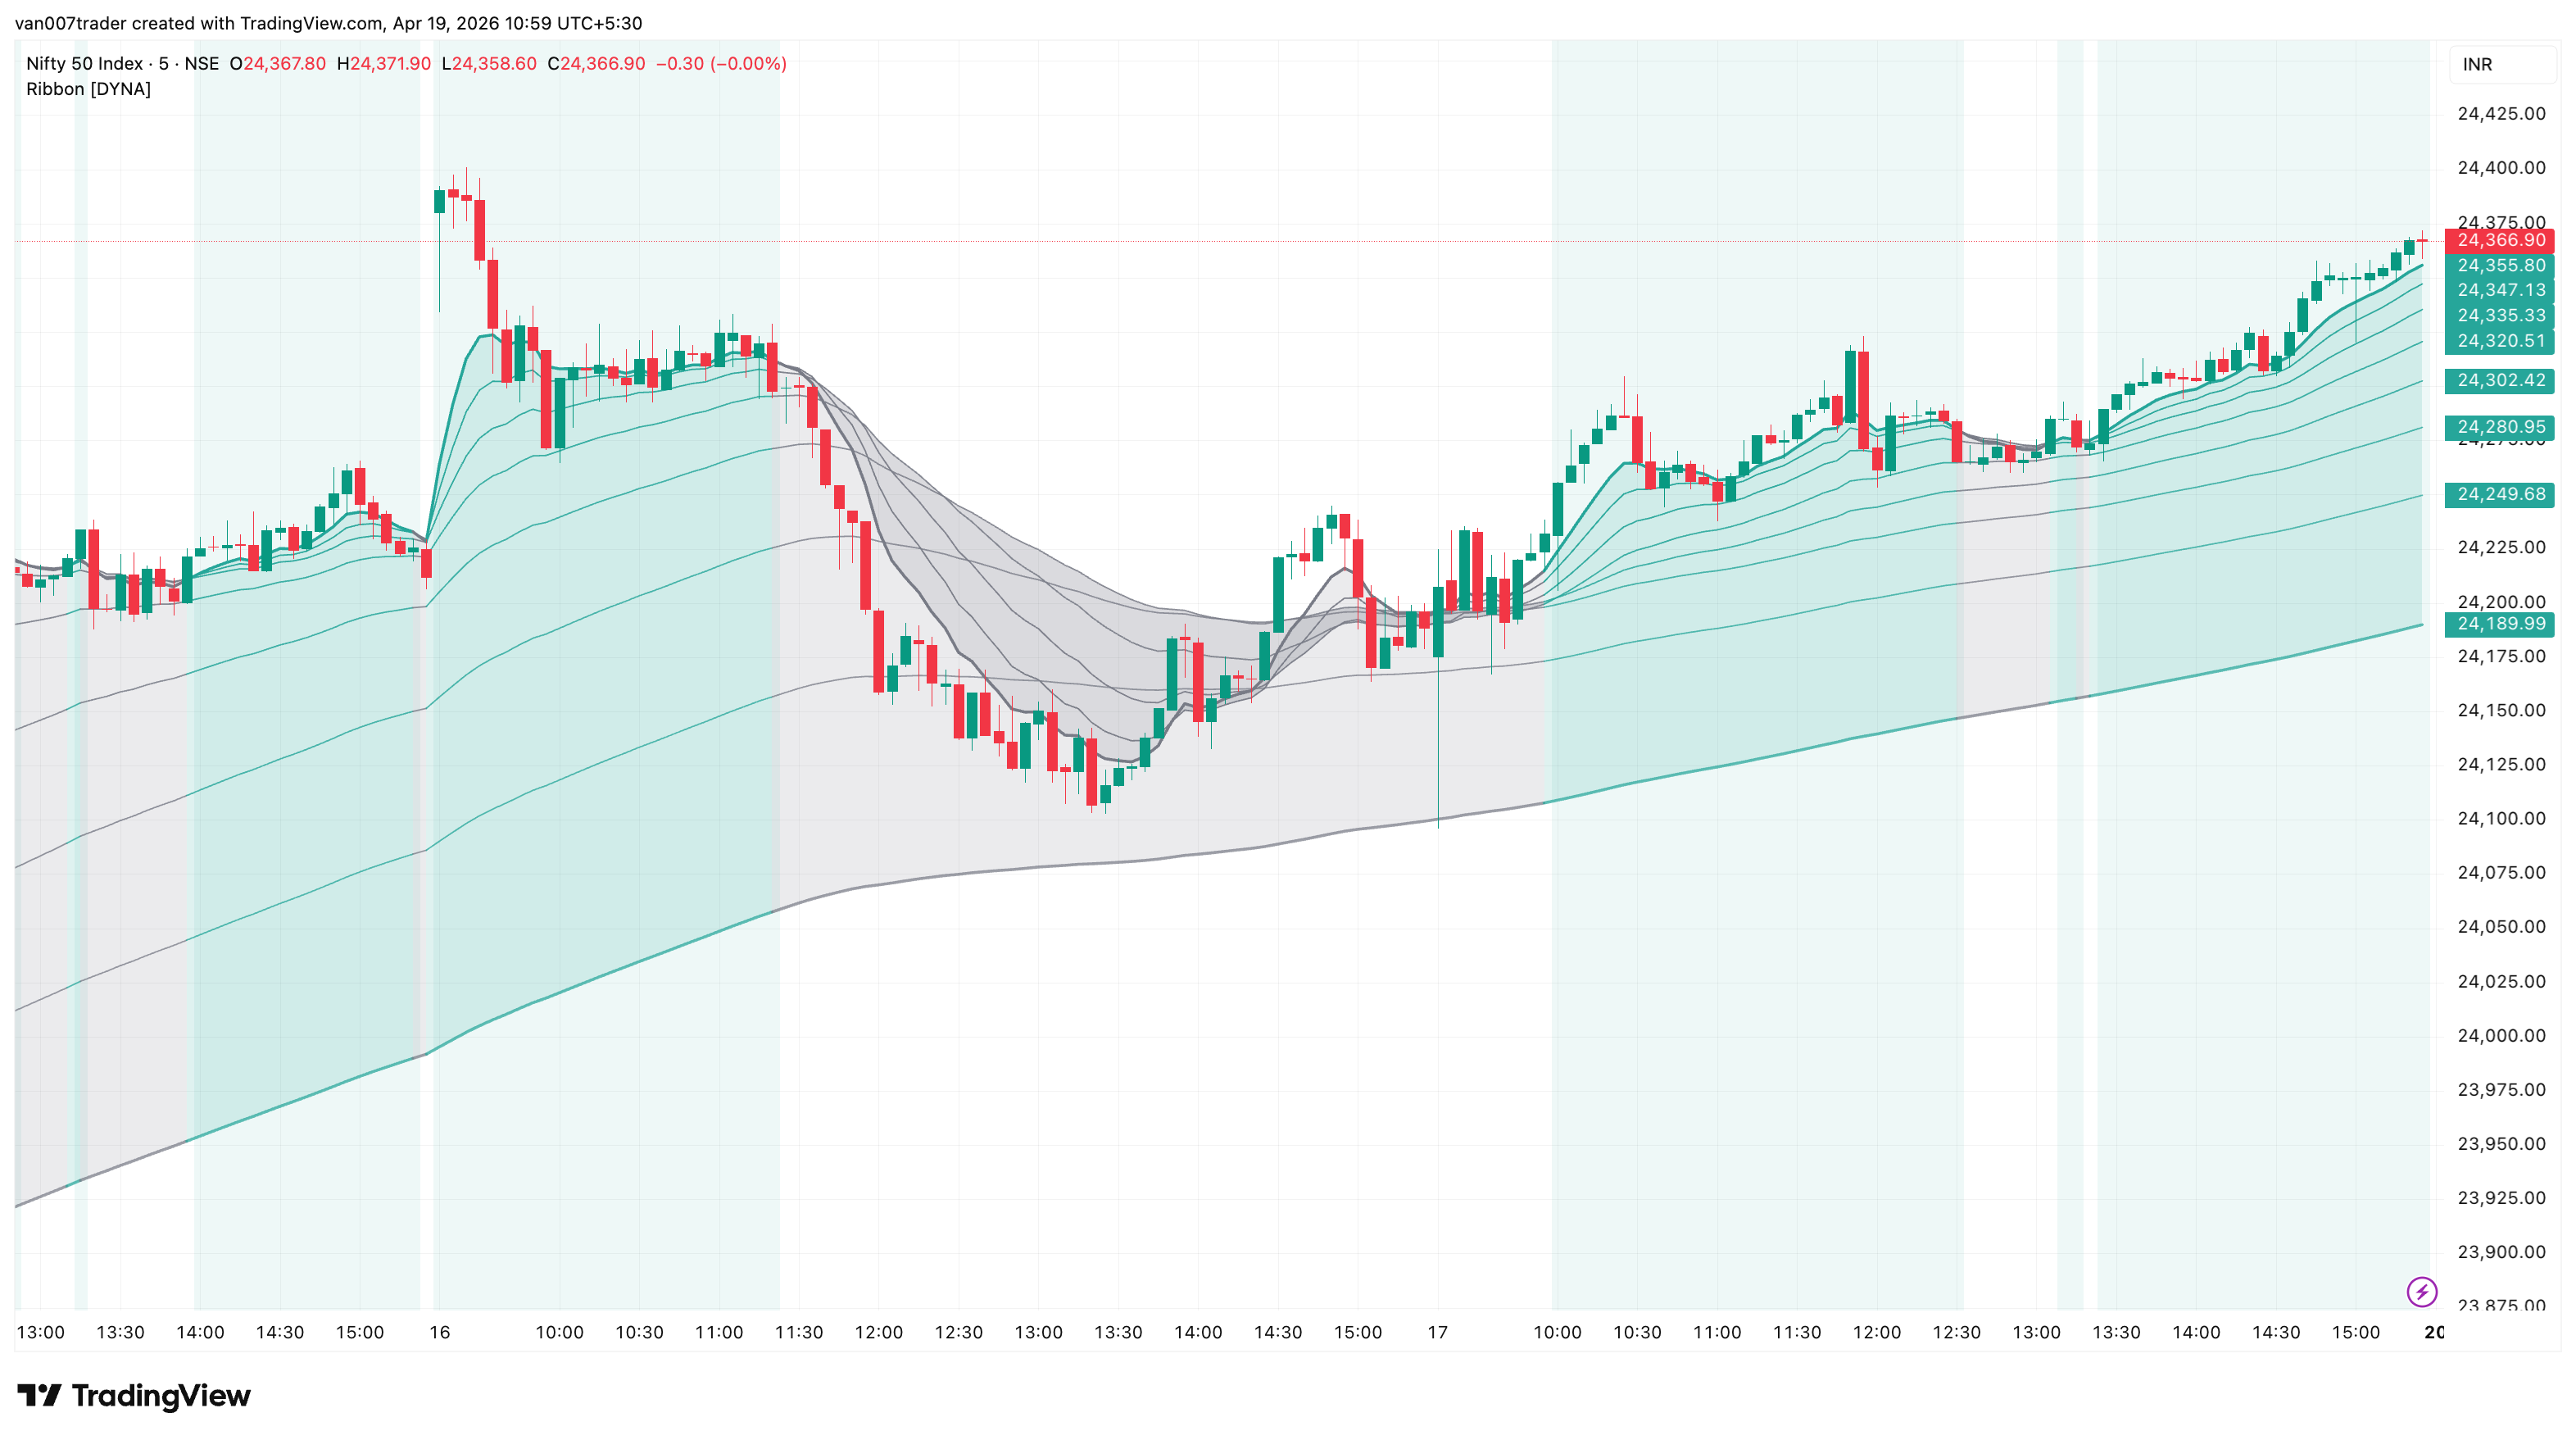
Intraday Trend Ribbon plots eight Fibonacci EMAs (8, 13, 21, 34, 55, 89, 144, 233) as a single coloured ribbon stacked on price. When the EMAs are perfectly fanned — fastest on top — the ribbon turns green and the chart background lights up bullish. When they are stacked the other way it turns red. Mixed and compressed? The ribbon goes grey and the indicator flags chop. The result is an at-a-glance read on whether the momentum, swing, and trend timeframes agree.
Most ribbon indicators colour every line with a separate state, leaving you to interpret the soup. This one collapses the eight EMAs into three regimes — fully bullish, fully bearish, chop — and wraps the chart background in the matching colour, so trend regimes, transitions, and consolidations are obvious without staring at line crossovers.
Key Features
- Eight Fibonacci EMAs — 8, 13, 21, 34, 55, 89, 144, 233 by default; every period is configurable.
- Strict Alignment Detection — The ribbon registers as bullish or bearish only when all eight EMAs are in strict monotonic order. No half-aligned states, no false trend signals.
- Chop Filter — A built-in compression detector flags windows where the ribbon collapses into a tight band, using ribbon width / ATR as the yardstick. Tunable via a single threshold input.
- Background Regime Highlight — Soft green / red when the ribbon is fully aligned, soft amber when chop is active. Toggleable.
- Per-Line Transparency Gradient — The fastest EMA is opaque; slower EMAs fade gradually so the ribbon reads as a single colour-graded fan rather than eight competing lines.
- Three Alerts — Bullish flip, bearish flip, chop start. All gated on confirmed bar close, no repainting.
- No Repainting — Every alert compares the current confirmed bar's state to the previous bar's state. Historical signals never move.
How It Works
The indicator computes eight EMAs of the configured source (default close) at the eight periods. Each bar it checks two conditions:
Fully bullish = ema8 > ema13 > ema21 > ema34 > ema55 > ema89 > ema144 > ema233 Fully bearish = the mirror
The ribbon colour is set by which (if any) of these holds. For chop, the ribbon's vertical span (max EMA minus min EMA) is divided by the current ATR; if the result is below the configured ceiling AND the ribbon is mixed (neither bullish nor bearish), the bar is marked as chop. ATR scaling makes the chop threshold work the same way across instruments and timeframes.
Edge events fire only on the first confirmed bar of a new state — the first bar that becomes fully bullish, the first bar that becomes fully bearish, the first bar that enters chop. Comparing each bar's state to the prior bar's state guarantees no repainting.
Settings
EMA Source (default: close) sets the price feed for every line. The eight period inputs (EMA 1 through EMA 8, defaults 8 to 233) define the ribbon; replace them with any other set if you prefer non-Fibonacci spacing.
Detect Chop (default: on) enables the compression detector. Chop ATR Length (default: 14) sets the ATR period, and Chop Width / ATR Ceiling (default: 0.5) controls strictness — raise toward 1.0 for more frequent chop flags, lower toward 0.3 to flag only the tightest compressions.
Show EMA Lines, Shade Between EMAs, and Background When Aligned are independent visibility toggles. Line Transparency (fastest) (default: 0) controls the opacity of the fastest line; the slower lines fade gradually from there.
The three alert toggles enable / disable the bullish-flip, bearish-flip, and chop-start alerts independently.
Alerts
- Ribbon Fully Bullish — Fires on the first confirmed bar where the ribbon enters a fully bullish stack. "Intraday Trend Ribbon [DYNA]: Ribbon flipped fully bullish — all 8 EMAs stacked fast over slow."
- Ribbon Fully Bearish — Fires on the first confirmed bar where the ribbon enters a fully bearish stack. "Intraday Trend Ribbon [DYNA]: Ribbon flipped fully bearish — all 8 EMAs stacked fast under slow."
- Ribbon Tangled (Chop) — Fires on the first confirmed bar where the ribbon becomes compressed and unaligned. "Intraday Trend Ribbon [DYNA]: Ribbon entered chop — EMAs compressed and unaligned."
To set up alerts: open TradingView's Alerts panel, choose "Intraday Trend Ribbon [DYNA]" from the condition dropdown, pick one of the three alert variants, and select your notification channel.
Best Practices
- Trade only with the regime. When the green or red background is active, the ribbon agrees on direction — this is the highest-edge environment for trend setups. Use counter-trend setups only when there is no background tint.
- Treat the slower EMAs (89, 144, 233) as dynamic trailing stops in a clean trend. A close that decisively crosses and stays beyond the 233 EMA usually marks the end of a regime.
- Use ribbon-width changes to read momentum. A widening fan = accelerating trend; a contracting fan = trend losing energy.
- Skip trades during the amber chop background. The compression flag catches typical midday consolidations and news-pause windows that most trend systems struggle with.
- Match the timeframe to your holding period. 1m / 5m flips often, 1h / 4h flips rarely. Pick the one whose flip cadence matches the trades you actually take.
- On instruments with very low volatility (post-close FX, holiday sessions), raise the Chop Width / ATR Ceiling so the chop filter does not stay active permanently.
Part of the DYNA Ecosystem
Intraday Trend Ribbon is a free indicator built with the same design standards as the DYNA premium suite. For complete trade management with automatic stop loss, break-even, trailing stops, and multi-target systems, explore the full DYNA indicator collection.
Disclaimer
This indicator is a technical analysis and educational tool only — it is not financial advice and makes no guarantee of any outcome. Past performance does not predict future results. Always do your own research and use proper position sizing and risk management.