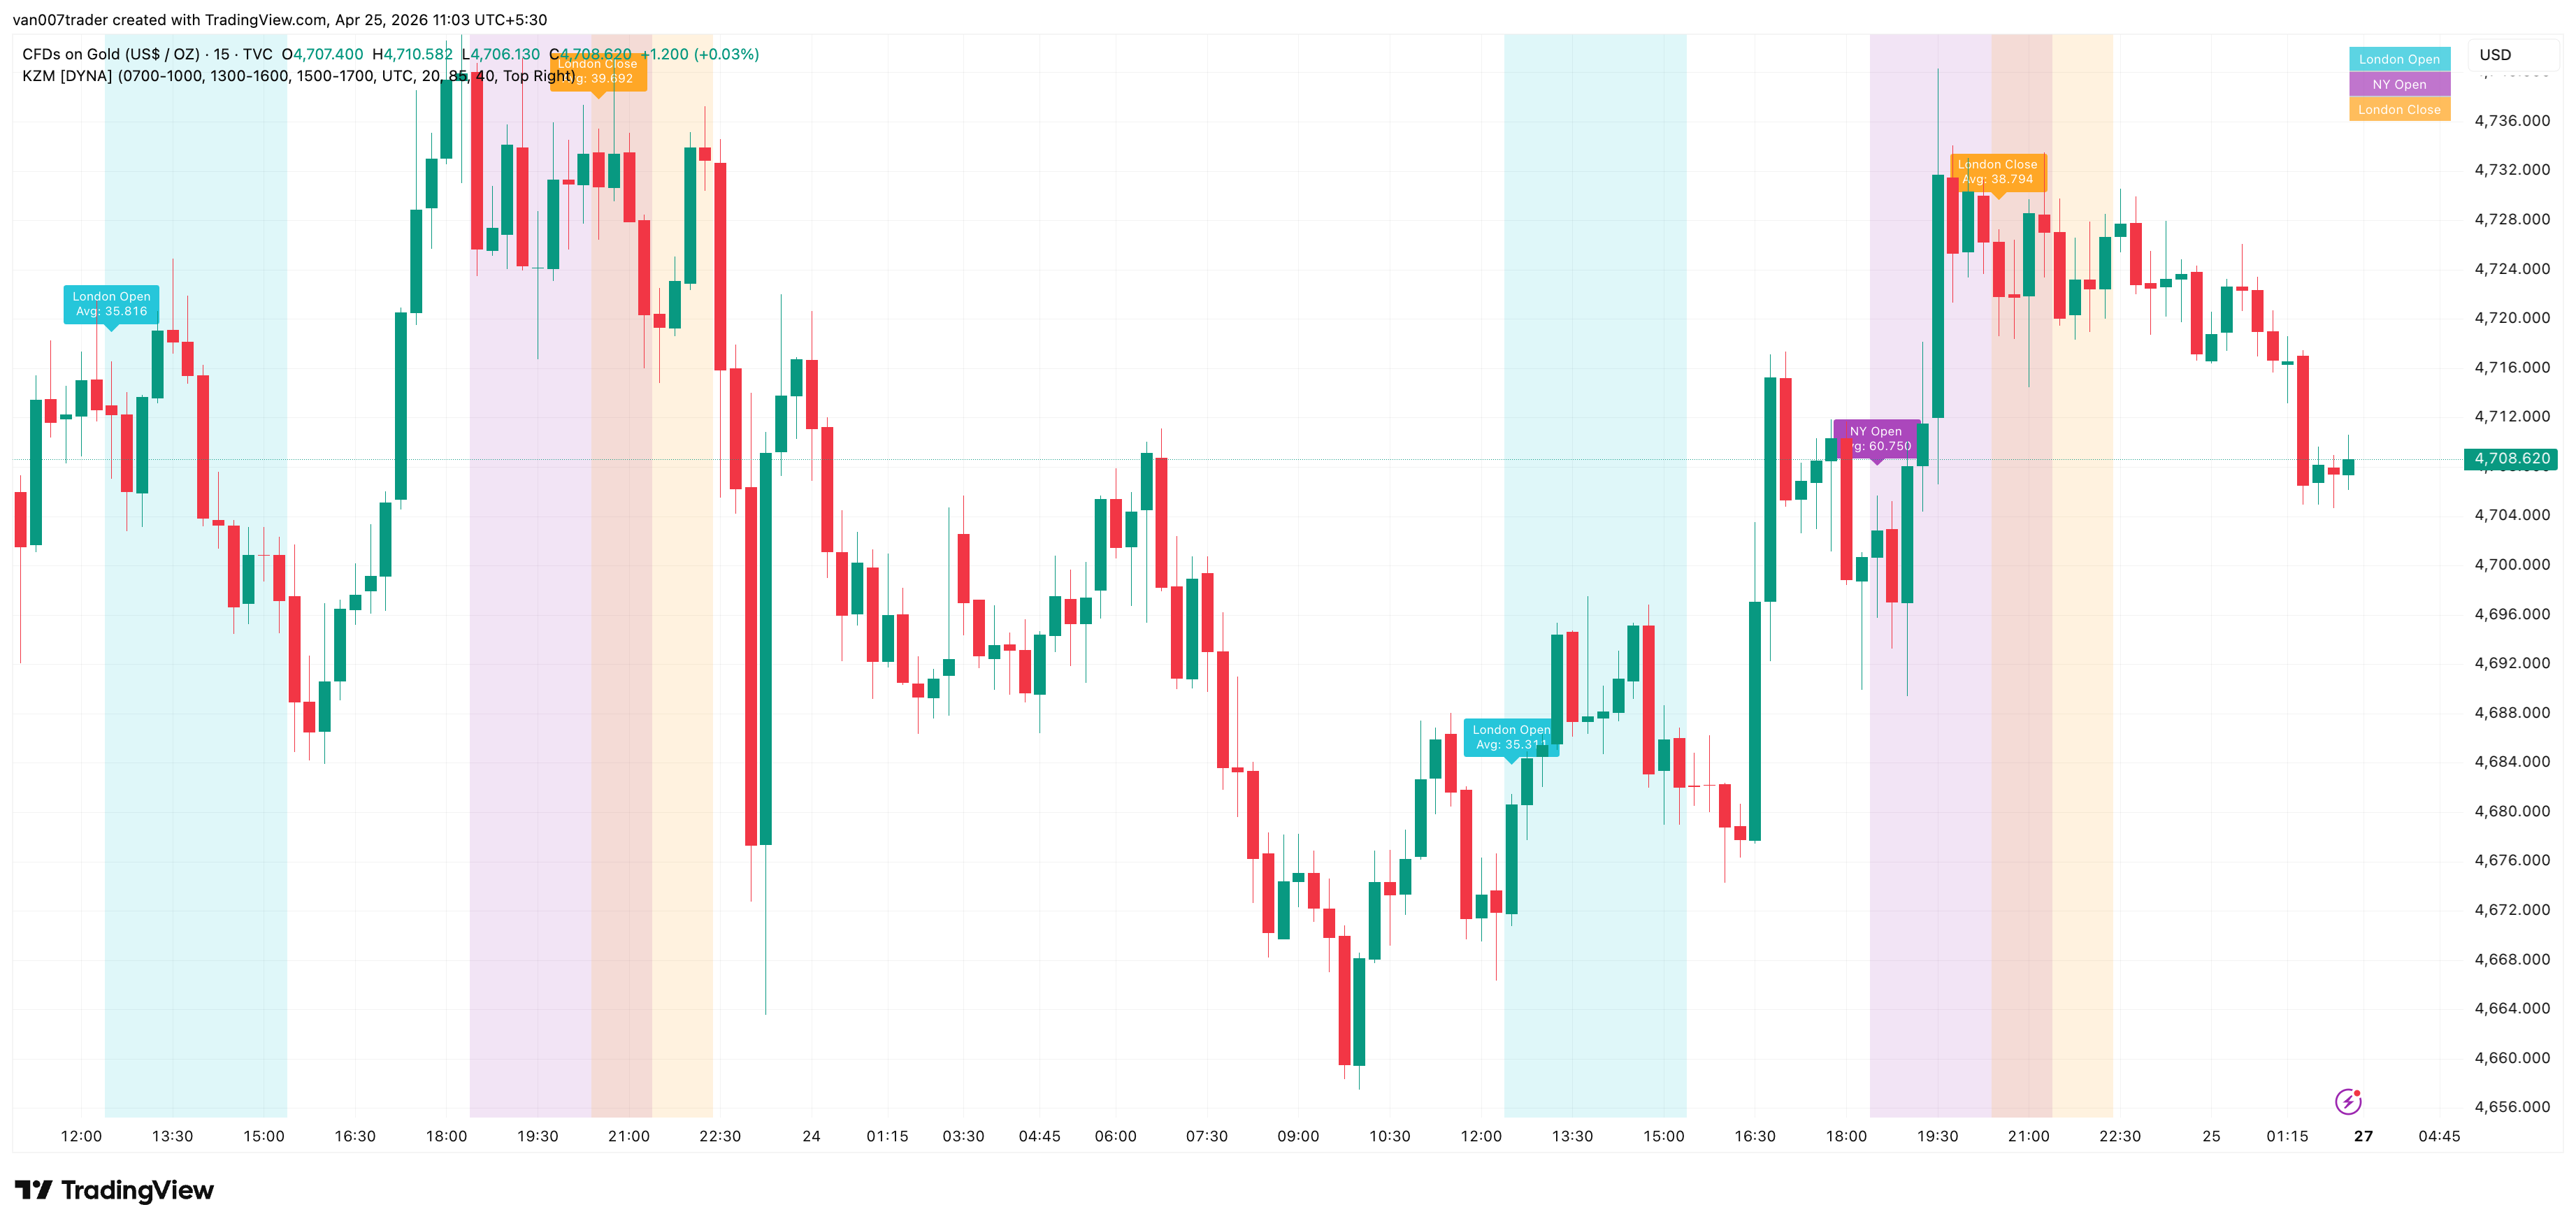
Kill Zone Marker highlights the three intraday windows that drive the bulk of daily volatility on FX, indices, and crypto: the London Open (07:00-10:00 UTC), the New York Open (13:00-16:00 UTC), and the London Close (15:00-17:00 UTC). Each kill zone gets its own translucent background band so the active high-volatility window is obvious at a glance.
At the start of every kill zone, a small label is posted above the chart showing the rolling average bar-range from the last N completed sessions of that same zone. Use the average as your "expected move" reference — a target inside it is conservative, a target much beyond it is asking the market to do more than it usually does in that window. All three windows, the timezone they are interpreted in, and the lookback length are user-configurable.
Key Features
- Three Configurable Kill Zones — London Open, New York Open, and London Close windows with independent colors, toggles, and timing. Free-text session strings let you customize each window without code edits.
- Rolling Average Range Per Zone — Each zone-start label shows the rolling average bar-range across the last N completed sessions of that zone (default N=20). Tells you at a glance whether the current zone is unfolding hot, cold, or about as expected.
- Editable Timezone — Interpret all three windows in UTC (default), New York, London, Tokyo, Sydney, Kolkata, or any other major financial center.
- Color-Coded Legend — Optional corner table maps each band color to its kill zone so the chart is always self-explanatory, even before the next zone opens.
- Per-Zone Start and End Alerts — Six independent alerts (start + end for each of the three zones) so you can tune which transitions you actually want to be notified about.
- Theme-Aware Transparency — Single transparency input controls all three kill-zone bands together. Tune for bright or dark chart themes.
- No Repainting — Detection is purely time-based and stable across reloads. The rolling average uses only completed prior sessions; the current zone's in-progress range never feeds back into its own label.
How It Works
For each bar, the indicator checks whether the bar's timestamp (interpreted in the configured timezone) falls inside the London Open, NY Open, or London Close window. If a bar is inside a zone, the chart background for that bar is tinted with that zone's color. The NY Open and London Close windows overlap by default (15:00-16:00 UTC) — the two band colors stack so the overlap is visible without a separate band.
Zone starts are detected with a daily-anchor timestamp comparison rather than a simple "previous bar was outside the zone" check. This is important because most TradingView intraday charts hide off-hours bars by default, so a naive previous-bar test would only fire on the very first chart load. The anchor-comparison method works reliably whether the chart includes off-hours bars or not.
While inside a zone, the indicator tracks the running high and low across all in-zone bars for that session. When the zone closes, that session's range (high - low) is appended to a rolling array of the last N session ranges and the in-progress trackers reset. The label posted at the start of the next occurrence of the same zone reads the average from the array — so it is always backward-looking and never includes the current zone's incomplete data.
Settings
The three kill-zone strings are entered in TradingView's standard HHMM-HHMM session format and accept the optional day-of-week mask (e.g. 0700-1000:23456 to limit London Open to weekdays only). All three windows are interpreted in the same Timezone, which defaults to UTC. The catalog defaults match the standard EST kill-zone definitions (02:00-05:00, 08:00-11:00, 10:00-12:00 EST) converted to UTC.
The Average Range Lookback input controls how many completed sessions feed each zone's rolling average. Defaults to 20; lower values track the current regime more closely, higher values give a more stable baseline.
The visual block exposes per-zone show toggles, per-zone color pickers, a single Background Transparency input (default 85), the Show Average-Range Labels toggle, a Max Labels to Keep limit (default 40), the Show Legend Table toggle, and a Legend Position dropdown that anchors the legend in any chart corner.
The alerts block exposes six toggles — start and end for each zone — so you can enable only the transitions you care about.
Alerts
- London Open Kill Zone Starting — Fires on the first bar of the London Open window each day. "Kill Zone Marker [DYNA]: London Open kill zone has started."
- London Open Kill Zone Ending — Fires on the first bar after the London Open window closes. "Kill Zone Marker [DYNA]: London Open kill zone has ended."
- NY Open Kill Zone Starting — Fires on the first bar of the NY Open window. "Kill Zone Marker [DYNA]: New York Open kill zone has started."
- NY Open Kill Zone Ending — Fires on the first bar after the NY Open window closes. "Kill Zone Marker [DYNA]: New York Open kill zone has ended."
- London Close Kill Zone Starting — Fires on the first bar of the London Close window. "Kill Zone Marker [DYNA]: London Close kill zone has started."
- London Close Kill Zone Ending — Fires on the first bar after the London Close window closes. "Kill Zone Marker [DYNA]: London Close kill zone has ended."
To set up an alert: open TradingView's Alerts panel, choose "Kill Zone Marker [DYNA]" from the condition dropdown, pick the event you want, and select your notification channel.
Best Practices
- Keep the timezone on UTC unless you have a specific reason to change it. UTC eliminates DST drift and matches how institutional desks reference kill-zone windows.
- Use the rolling average as your "expected move" reference for each zone — targets and stops sized to that average tend to behave more predictably than fixed-pip values.
- On dark chart themes, lower the background transparency to 75-82 for stronger color. On light themes, push it up to 88-92 so the bands stay readable.
- On instruments that only trade inside one window (e.g. a regional equity market whose session overlaps a single kill zone), turn off the irrelevant kill zones to reduce visual clutter.
- If your broker or instrument has a non-standard high-volatility window (e.g. EIA inventory release for energy futures, FOMC release for rates), repurpose one of the three zones to that window — the rolling average makes any custom window's typical behavior immediately visible.
- Use the day-of-week mask (e.g. 0700-1000:23456) to suppress weekend kill-zone bands on forex charts.
Part of the DYNA Ecosystem
Kill Zone Marker is a free indicator built with the same design standards as the DYNA premium suite. For complete trade management with automatic stop loss, break-even, trailing stops, and multi-target systems, explore the full DYNA indicator collection.
Disclaimer
This indicator is a technical analysis and educational tool only — it is not financial advice and makes no guarantee of any outcome. Past performance does not predict future results. Always do your own research and use proper position sizing and risk management.