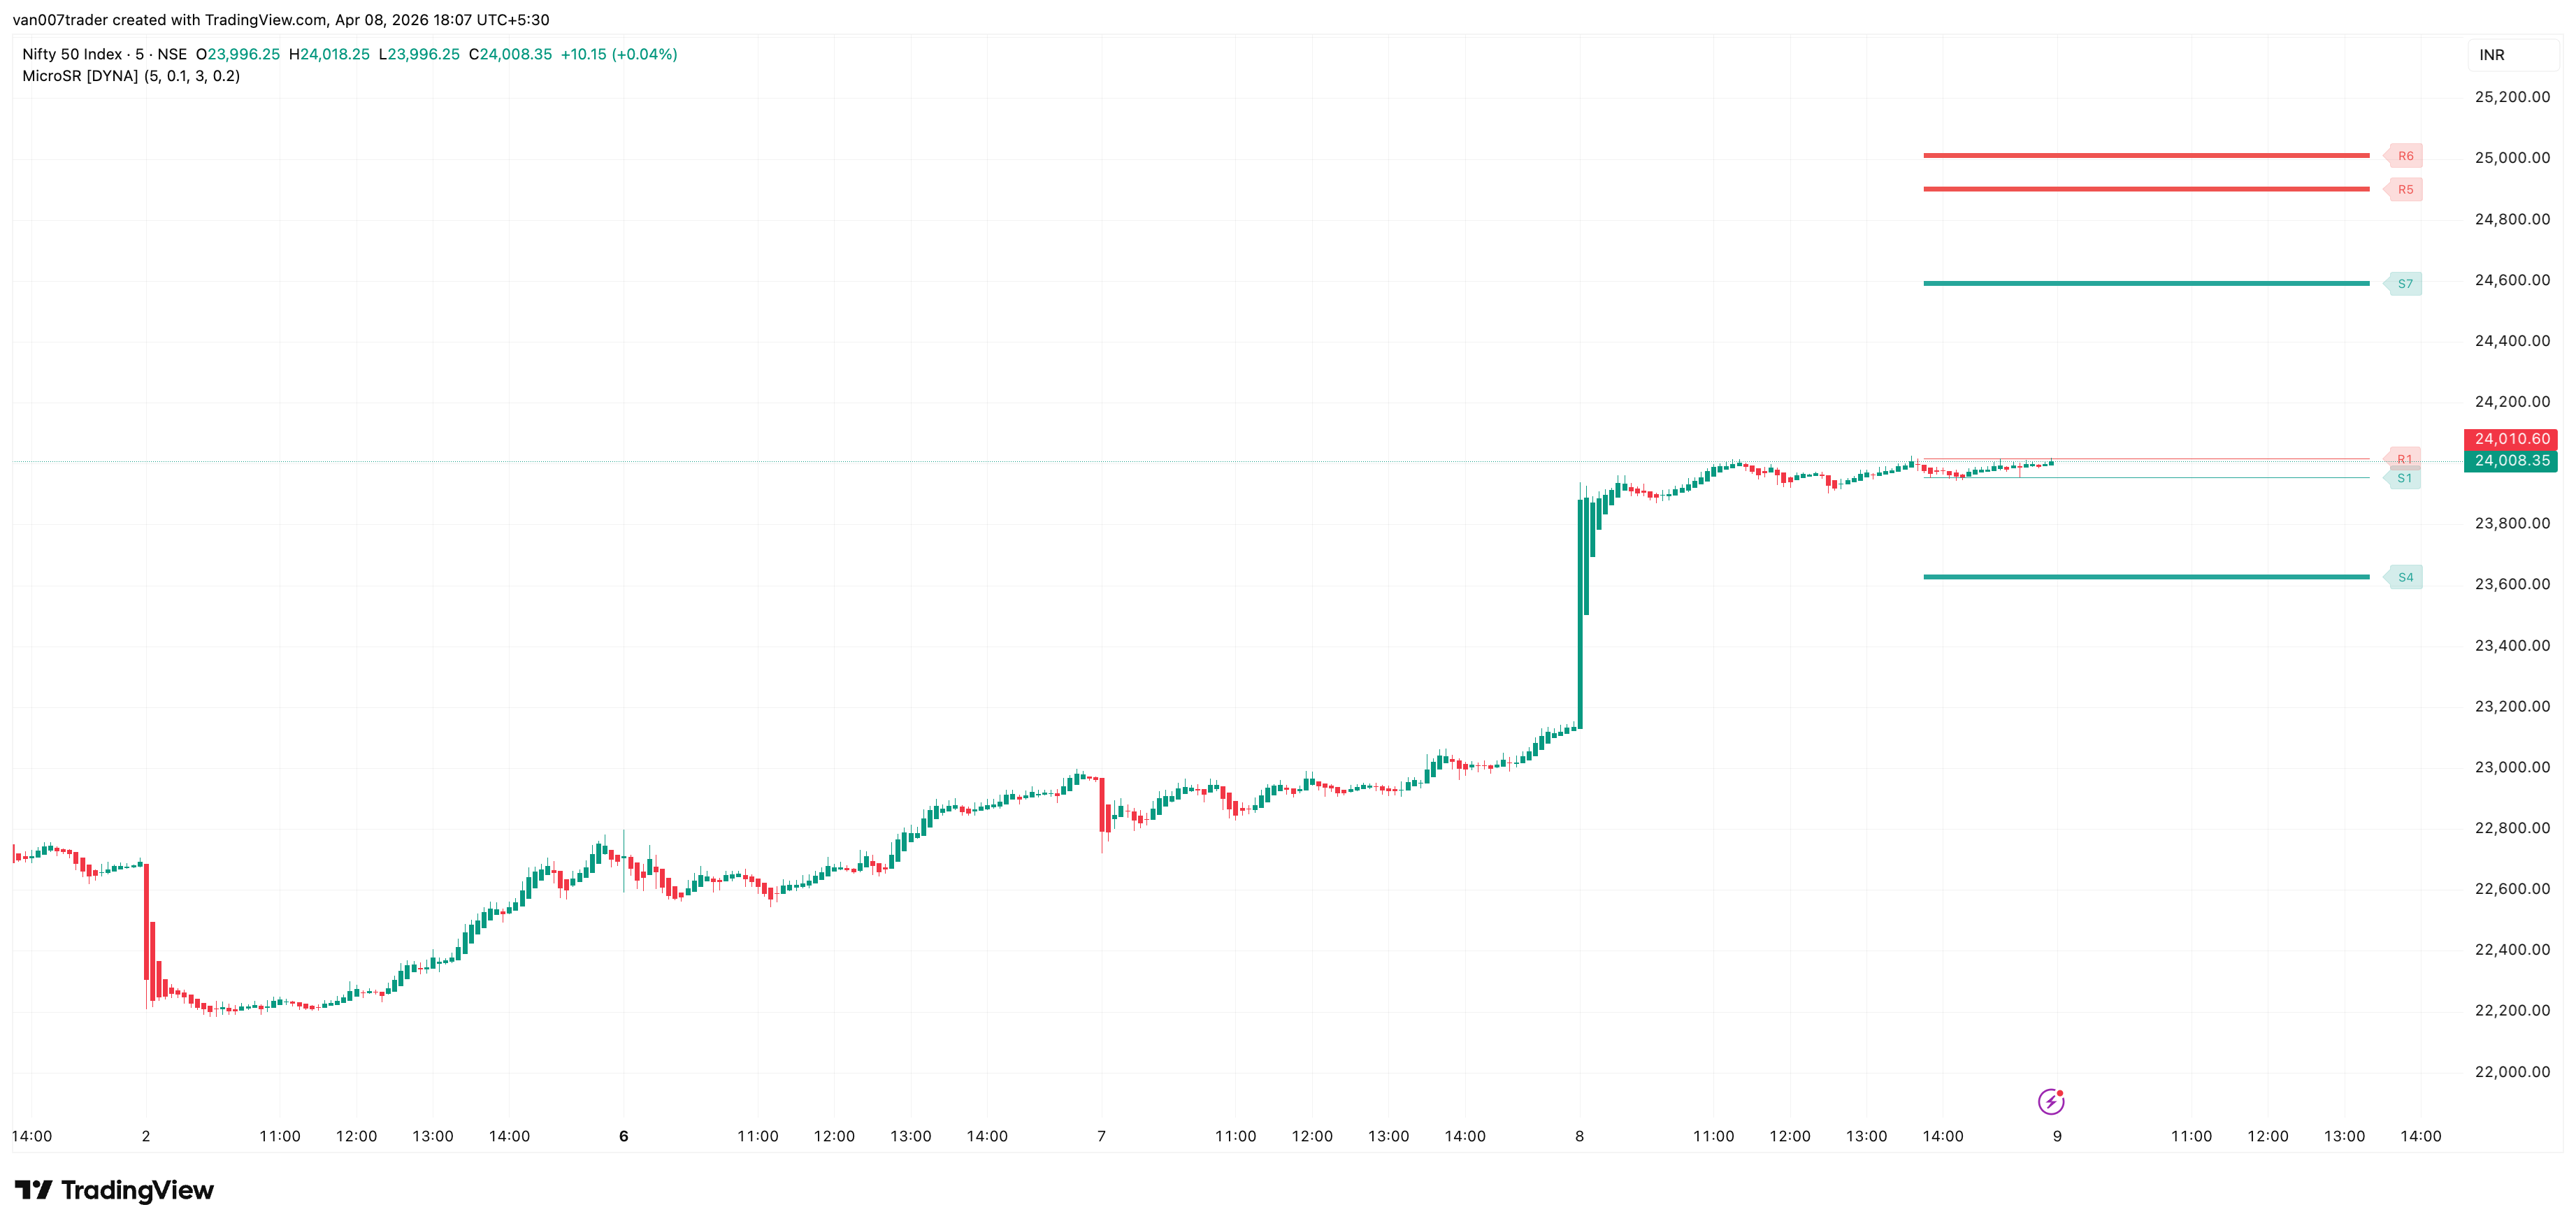
Micro Support Resistance automatically identifies the most important short-term support and resistance levels on your chart. It finds swing highs and swing lows, clusters nearby price reactions together, and draws clean horizontal lines where price is most likely to react next.
Most traders draw support and resistance by hand, which is slow and subjective. This indicator does it for you in real time, updating as new pivots form. It also shows you which levels are strongest — thicker lines mean more touches, so you can instantly tell the difference between a fresh untested level and a well-established zone that price has bounced off multiple times. When price breaks through a level, the indicator automatically removes it so only active, relevant zones remain on your chart.
Key Features
- Automatic Pivot Detection — Identifies swing highs and swing lows using a configurable lookback window, so levels are always based on actual price structure
- Smart Clustering — Merges nearby levels within an ATR-based threshold into a single zone, avoiding cluttered charts with redundant lines
- Touch Count Visualization — Line thickness grows with each touch, giving you an instant read on level strength without any interpretation
- Automatic Level Invalidation — When price closes through a support or resistance level, it is removed from the chart. No stale or broken levels cluttering your view
- Distance-Based Decay — Levels that drift too far from current price automatically lose touches and eventually disappear, keeping all level slots focused on actionable zones near price
- Dynamic Level Management — Keeps only the strongest levels on screen. When new pivots form, weak untested levels are replaced automatically
- First-Approach Alerts — Get notified the moment price first reaches a key level, not on every bar it stays nearby
- Data Export — All level values appear in the TradingView data window and are included in CSV exports for further analysis
How It Works
As price moves across your chart, the indicator continuously scans for swing highs and swing lows on confirmed bars. When it detects a confirmed pivot — a point where price reversed direction with bars on both sides confirming the swing — it checks whether this level is near any existing support or resistance zone. If it is, the existing level absorbs the new touch and its line gets thicker. If not, a new level is drawn. When price closes through a level decisively, that level is automatically invalidated and removed.
Green lines mark support zones where price has bounced upward. Red lines mark resistance zones where price has been rejected downward. Each line carries a small label showing its level number and touch count — for example, "S1 (3)" is the first support level with three touches, and "R2 (1)" is the second resistance level with a single touch. Thicker lines correspond to higher touch counts, so a bold line with "S1 (4)" is a well-tested support, while a thin line with "R3 (1)" is a fresh, untested resistance. If a green line disappears, it means price closed below that support and the level is no longer valid.
Line Thickness and Level Strength
The visual weight of each line tells you how significant the level is. One touch produces a thin hairline. Two touches make it slightly thicker. Three or four touches produce a bold, unmistakable line that commands attention. This means you never need to count bounces or remember which levels have been tested — the chart shows you directly.
When the maximum number of levels is reached on either side (support or resistance), the indicator automatically removes the weakest level to make room for a new one. Levels that have been broken through — where price has closed on the other side — are also removed automatically. This keeps your chart clean and focused on the levels that actually matter right now.
Settings
The default settings work well for most intraday charts on the 1-minute to 15-minute timeframe. The Pivot Lookback controls how many bars on each side are required to confirm a swing — the default of 5 captures short-term micro-structure. Increase it to 7 or 10 for slightly broader levels on 30-minute or 1-hour charts.
The Cluster Threshold determines how close two levels need to be before they are merged into one. It uses a multiple of the 14-period ATR, so it automatically adapts to different instruments and volatility conditions. The default of 0.5 provides a good balance between merging nearby levels and keeping distinct zones separate. Lower it if you want finer granularity; raise it if you see too many lines stacked close together.
Max Levels Per Side caps how many support and resistance lines appear at once. The default of 3 keeps the chart clean. You can increase it up to 10 if you want to see more of the price structure.
The Decay Distance setting controls how far a level can be from price before it starts losing relevance. Levels beyond this ATR multiple lose one touch per confirmed bar. Once a level's touches reach zero, it is removed and the slot opens up for a fresh nearby level. The default of 10x ATR keeps levels focused on the current trading range while ensuring slots stay populated. Increase it if you want levels to persist longer on swing or position trades.
Alerts
- Approaching Support — Fires once when price first comes within a configurable percentage of a support level. Does not repeat while price remains in the approach zone. "Micro Support Resistance [DYNA]: Price is approaching a support level. Watch for a potential bounce or breakdown."
- Approaching Resistance — Fires once when price first comes within a configurable percentage of a resistance level. Does not repeat while price remains in the approach zone. "Micro Support Resistance [DYNA]: Price is approaching a resistance level. Watch for a potential rejection or breakout."
To set up alerts: click the TradingView Alerts button, select "Micro Support Resistance [DYNA]" from the indicator dropdown, choose "Any alert() function call" as the condition, and set your preferred notification method.
Best Practices
- Use on lower timeframes (1m to 15m) for scalping and intraday setups. The levels are designed to capture micro-structure, not weekly zones.
- Pay attention to thick lines — levels with 3 or more touches tend to produce stronger reactions when retested.
- Combine with a momentum or volume indicator to judge whether a level will hold or break.
- If your chart looks too busy, reduce Max Levels Per Side or increase the Cluster Threshold to merge nearby zones.
- Set approach alerts so you can step away from the screen and still catch the moments that matter.
Part of the DYNA Ecosystem
Micro Support Resistance is a free indicator built with the same design standards as the DYNA premium suite. For complete trade management with automatic stop loss, break-even, trailing stops, and multi-target systems, explore the full DYNA indicator collection.
Disclaimer
This indicator is a technical analysis and educational tool only — it is not financial advice and makes no guarantee of any outcome. Past performance does not predict future results. Always do your own research and use proper position sizing and risk management.