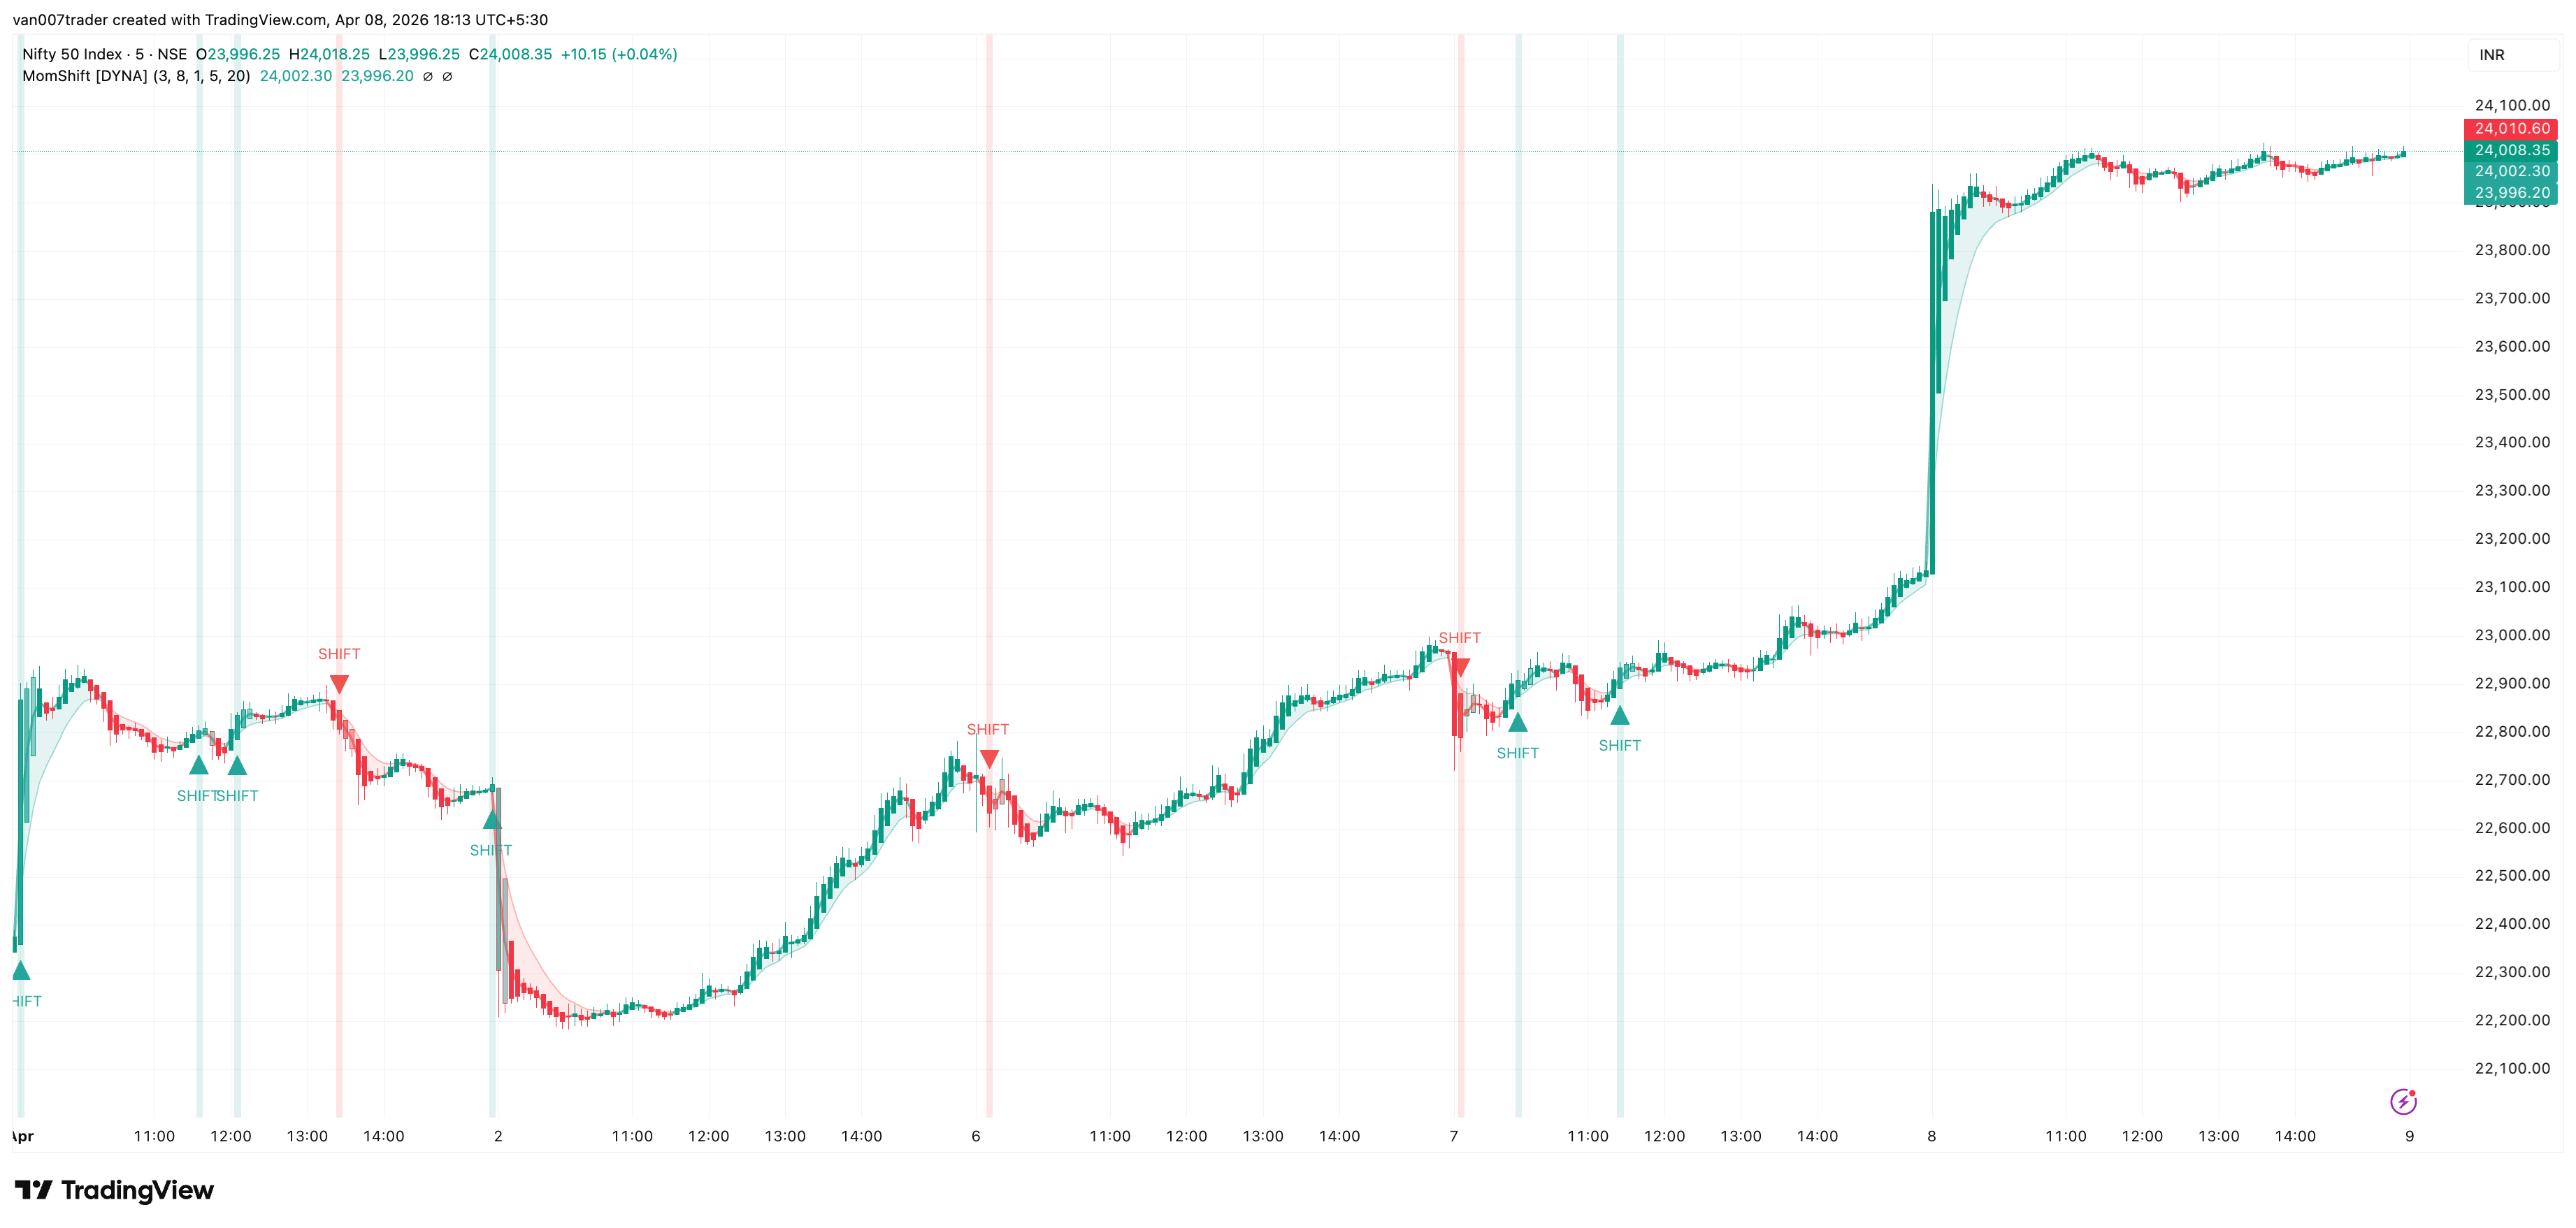
Momentum Shift Detector pinpoints the exact bar where short-term momentum changes direction. Instead of showing every EMA crossover, it applies four independent filters to surface only the shifts that matter — giving you clean, actionable turning-point signals directly on your price chart.
Most EMA crossover tools flood the chart with signals, many of which occur in the middle of a move when the easy money has already been made. Momentum Shift Detector solves this by requiring four conditions to align simultaneously: the cross itself, a minimum EMA spread threshold to eliminate weak whipsaw crosses, a volume surge confirming real participation, and proximity to a recent swing extreme proving that price actually reversed at a meaningful level.
Key Features
- Quad-Filter Signal Engine — Combines EMA crossover, EMA spread threshold, volume confirmation, and pivot proximity into a single high-conviction signal
- Anti-Whipsaw EMA Spread Filter — Requires the fast and slow EMAs to separate by a minimum fraction of ATR before a cross counts, eliminating weak crosses that immediately reverse
- Swing Pivot Awareness — Only fires when the momentum shift occurs near an actual swing high or swing low, filtering out mid-trend noise
- Volume Confirmation — Requires above-average volume on the crossover bar, ensuring real market participation backs the shift
- Confirmed-Bar Logic — Signals are calculated on closed bars so they never repaint or disappear after appearing
- Trend-Colored EMA Cloud — Fast and slow EMAs with a shaded fill that switches between green and red as the trend changes, giving instant directional context
- Multi-Layer Visual Feedback — Labeled triangle markers, bar coloring that fades over 3 bars, and a background flash on the shift bar so you never miss a signal
How It Works
The indicator runs a fast EMA (default period 3) and a slow EMA (default period 8) on every bar. When the fast EMA crosses above the slow EMA, a potential bullish shift is detected. When it crosses below, a potential bearish shift is detected. But the signal does not fire yet.
Next, the EMA spread filter checks whether the gap between the fast and slow EMAs exceeds a minimum fraction of ATR(14). This prevents whipsaw signals where the EMAs barely cross before reversing — a common problem on lower timeframes with choppy price action.
Then, the volume filter checks whether the crossover bar had trading volume above the user-defined multiplier (default 1.3x) times the 20-bar average volume. This ensures the shift is backed by genuine market activity, not just thin, random price movement.
Finally, the pivot proximity filter checks whether a recent swing low (for bullish shifts) or swing high (for bearish shifts) was detected within a defined number of bars. This is the key differentiator — it means the momentum flip is happening at a place where price actually turned around, not somewhere in the middle of an existing trend.
When all four conditions align, a green triangle labeled "SHIFT" appears below the bar for a bullish flip, or a red triangle above the bar for a bearish flip. The bars around the signal are tinted to match and a subtle background flash highlights the exact moment of the shift. Meanwhile, the fast and slow EMAs are plotted with a color-coded cloud fill that shows the prevailing trend direction at a glance — green when momentum is bullish, red when bearish.
Settings
The core settings control the sensitivity of each filter. The Fast EMA Length (default 3) and Slow EMA Length (default 8) define the crossover speed — shorter values react faster but may produce more signals. The Min EMA Spread (default 0.1) sets the minimum fast/slow EMA gap as a fraction of ATR(14) — raise it to 0.2-0.3 on higher timeframes or set to 0 to disable. The Volume Multiplier (default 1.3) sets the minimum volume threshold as a multiple of the 20-bar average; raising it to 1.5 will require even stronger volume confirmation. The Pivot Proximity setting (default 5 bars) controls how close the signal must be to a detected swing pivot. The Volume Average Length (default 20) determines the lookback window for calculating average volume.
Visual toggles let you independently show or hide bullish and bearish shift markers, the EMA lines and cloud fill, bar coloring around shift events, and the background flash highlight. Alert toggles let you enable notifications for each shift type separately.
Alerts
- Bullish Momentum Shift — Fires when a confirmed bullish crossover occurs with volume above threshold near a recent swing low. "Momentum Shift Detector [DYNA]: Bullish momentum shift detected."
- Bearish Momentum Shift — Fires when a confirmed bearish crossover occurs with volume above threshold near a recent swing high. "Momentum Shift Detector [DYNA]: Bearish momentum shift detected."
To set up alerts: click the TradingView Alerts button, select "Momentum Shift Detector [DYNA]" from the indicator dropdown, choose "Any alert() function call" as the condition, and set your preferred notification method.
Best Practices
- Use the dots as confirmation alongside your existing support/resistance levels, trendlines, or other indicators rather than as a standalone entry trigger
- On higher timeframes (4H, Daily), consider widening the EMAs to 5/13 for smoother signals suited to swing trading
- If signals are too frequent for your style, raise the Volume Multiplier above 1.3 or increase the Min EMA Spread to 0.2-0.3 to require stronger confirmation
- Pay attention to signals that cluster at the same price zone across multiple timeframes — these tend to mark the strongest reversals
- The pivot proximity filter is the main quality gate; lowering it to 3 allows faster signals while raising it to 7-10 requires more established swing points
Part of the DYNA Ecosystem
Momentum Shift Detector is a free indicator built with the same design standards as the DYNA premium suite. For complete trade management with automatic stop loss, break-even, trailing stops, and multi-target systems, explore the full DYNA indicator collection.
Disclaimer
This indicator is a technical analysis and educational tool only — it is not financial advice and makes no guarantee of any outcome. Past performance does not predict future results. Always do your own research and use proper position sizing and risk management.