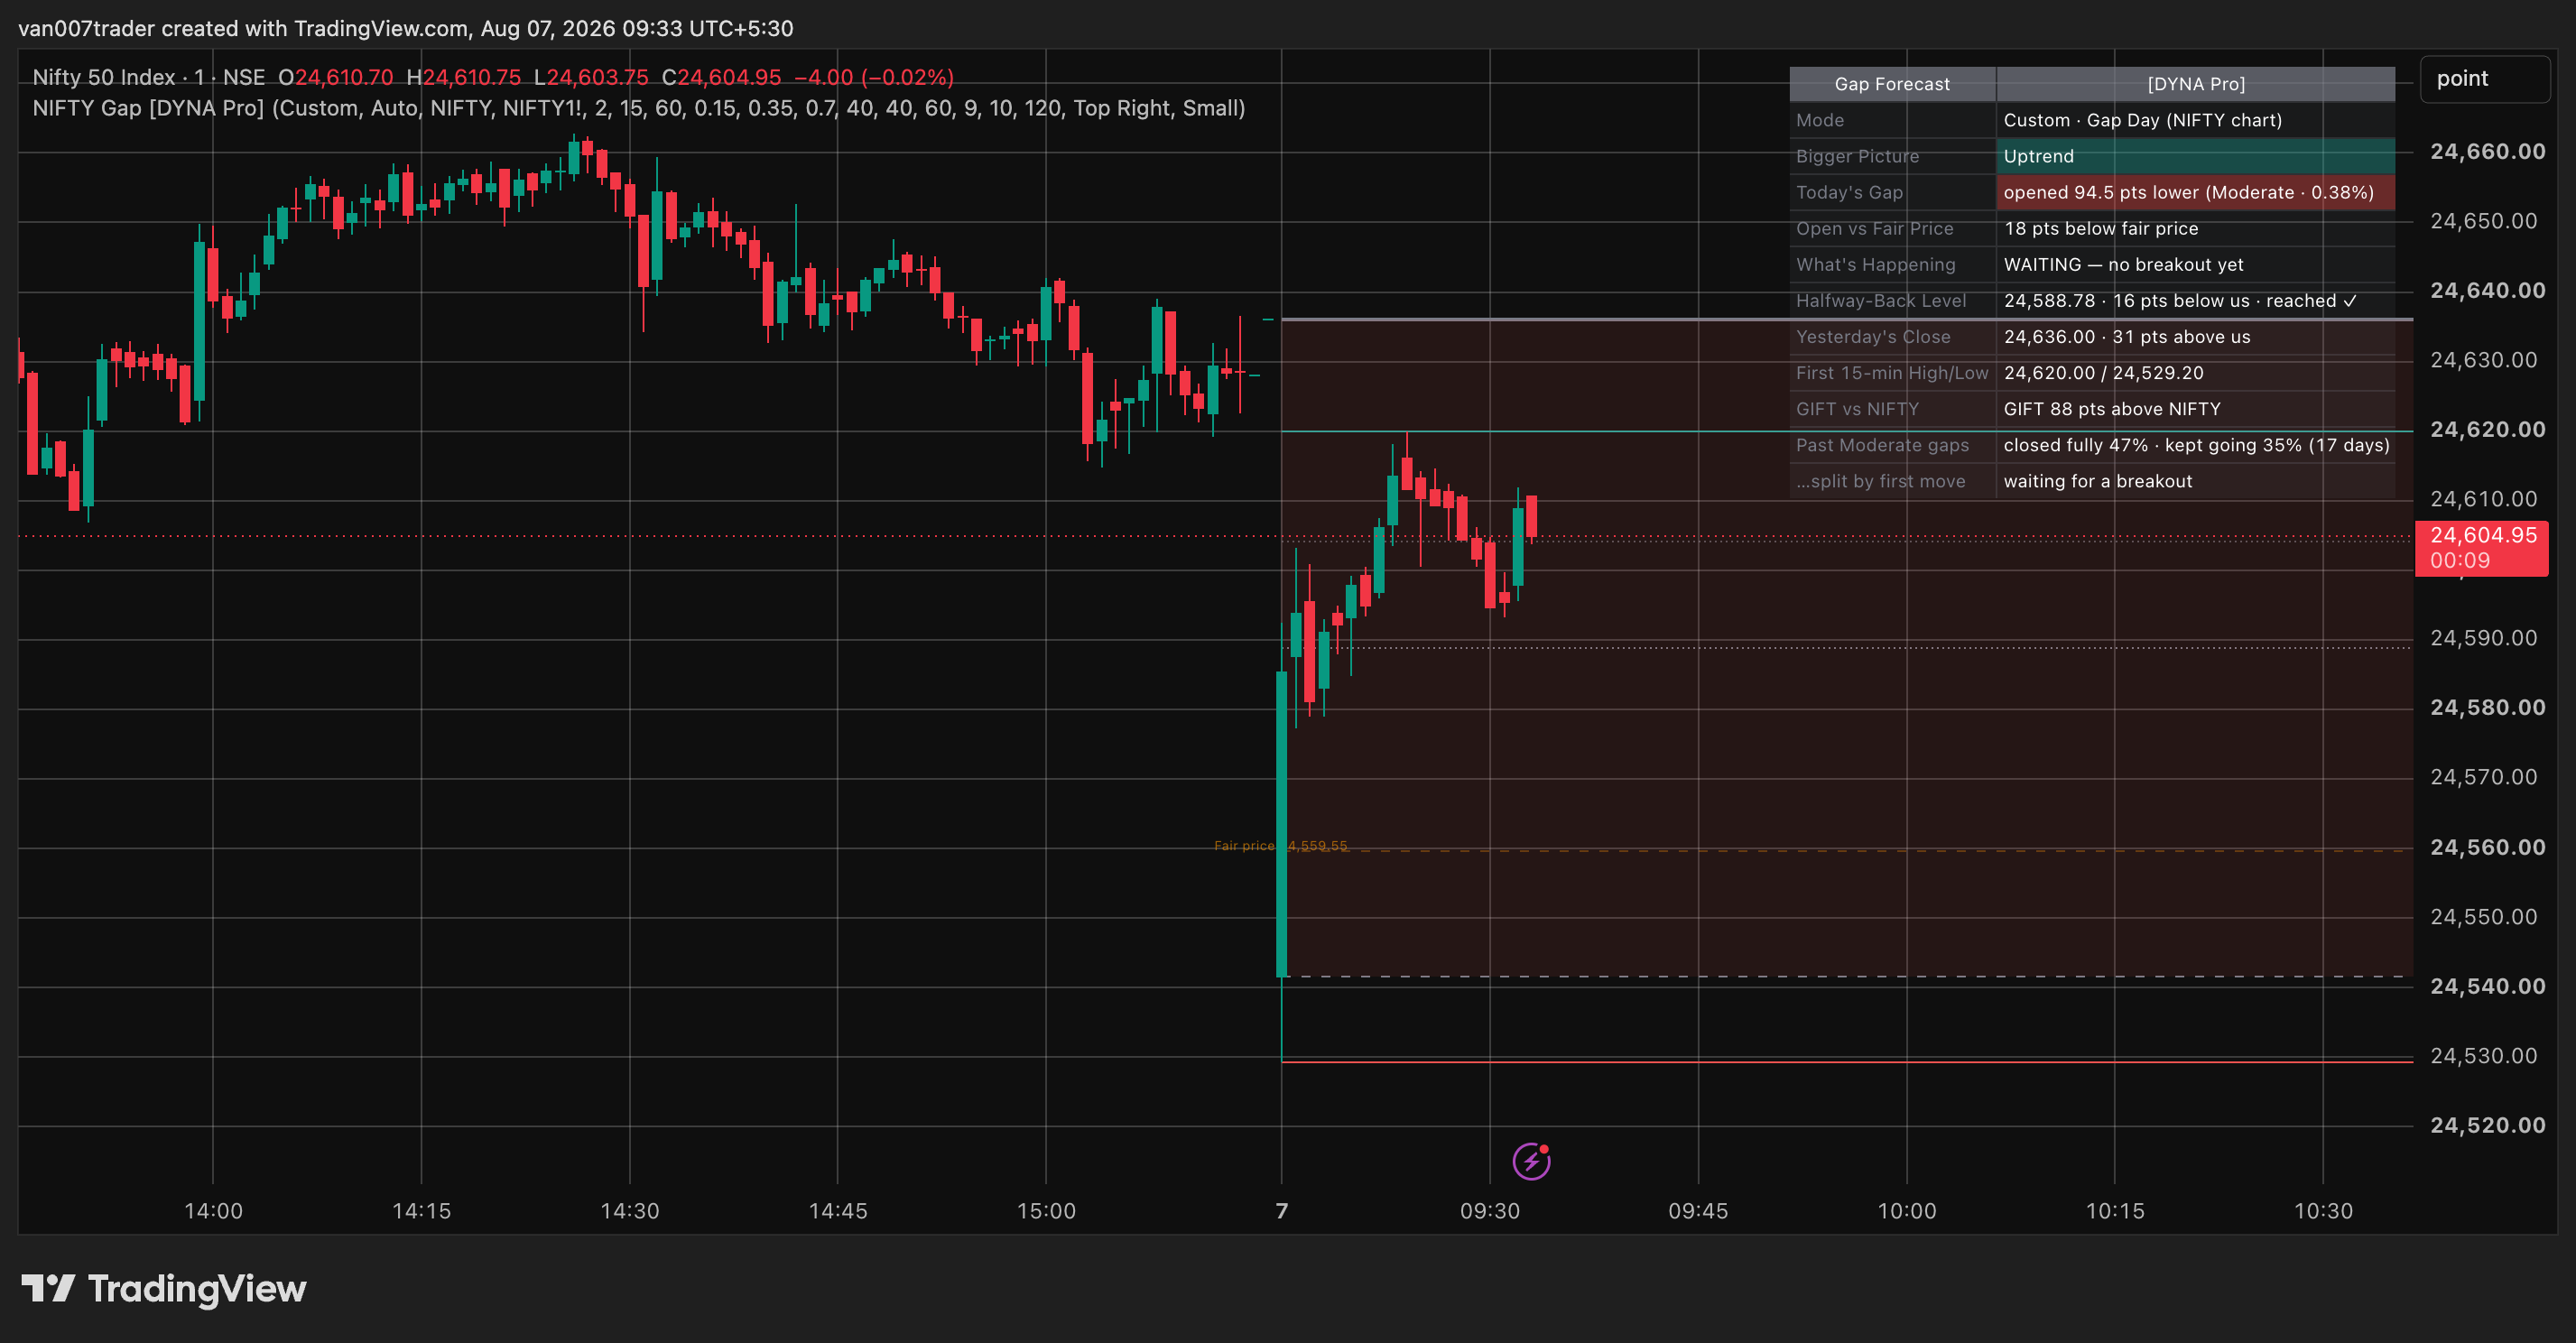
NIFTY Gap Forecast Engine is a two-in-one tool built for a single job: the NIFTY 50 opening gap. Put it on the GIFT Nifty chart and it estimates where NIFTY is likely to open tomorrow. It always shows that estimate as a range, never a single number. Put it on the NIFTY chart and it turns the morning gap into a plain-language playbook: how big the gap is, what similar gaps have done in the past, and what today is doing right now.
One script covers both, and it knows which chart it is on. GIFT Nifty trades almost around the clock, but it sits a little above or below NIFTY. The tool measures that price gap live, subtracts it from the GIFT price, and grades its own forecast every single morning. So the range you see is built from how the tool has actually performed on your chart, not from an assumption.
Everything on screen is written in plain words — "GAP RUNNING UP", "CLOSING THE GAP", "NO DIRECTION — STAND ASIDE" — so you are never decoding short forms while the market is moving.
Key Features
- Tomorrow's likely NIFTY open, shown on the GIFT chart as a range — the estimate plus or minus how far off the tool has usually been
- The forecast locks at a set time before the open, then reports how close it was once the real open prints
- Gap size classes — Flat, Small, Moderate, Large — with cut-offs set from a year of past data
- A gap-day tracker on the NIFTY chart: gap running, closing the gap, fully closed, bounced, broke through, or no direction
- A fair-price line every session — thin and faded when the open is near it, bright and labelled when the open is far from it, and flagged the moment the market opens
- History rows: what gaps of today's size have done before, split by how the day started
- A warning on the days each month when the GIFT contract changes over and the price gap jumps
- Live dashboard, day-type labels, coloured background, and a full set of normal alerts plus webhook alerts
How It Works
The tool takes a reading each bar while both markets are open, from 09:15 to 15:25 IST: the GIFT price minus the NIFTY price. That is the price gap between the two. It keeps the readings from the last completed sessions and uses the middle value, so one odd bar cannot pull it around. The likely NIFTY open is then just the current GIFT price minus that price gap. Compare it with yesterday's closing price and you get the expected gap in points, in percent, and as a size class.
Before the NSE open, the forecast locks on the last GIFT bar that closes at or before the set lock time. When the real open prints, the tool measures how far off it was and adds that to its own error record. That record is what draws the range around every forecast. Once a month the GIFT contract changes over and the price gap jumps; on those days the dashboard flags the forecast until things settle.
On the NIFTY chart, the day starts with a map of levels: today's open, yesterday's close, the halfway point between them, and yesterday's high and low. The first 30 minutes of trading set an opening range — simply the high and low of that stretch. A close outside that range decides the day: moving with the gap (running) or against it (closing). Touches of the halfway point and of yesterday's close are marked as they happen. After a full gap close, one more bar tells you whether price bounced there or broke straight through. If nothing breaks out by the cut-off time, the day is called directionless.
The open is also compared with the fair price — what GIFT says NIFTY is worth at that moment. A big difference gets flagged right at 09:15. That is on purpose: the pull-back back towards fair price usually plays out in the first half hour, so waiting for a closed bar would miss it. The opening price can never change afterwards, so flagging it early is safe.
Everything else comes from bars that have already closed, and all data pulled from the other symbol uses closed bars too. Nothing on the chart changes after the fact.
Presets
There is one preset, called Default, plus Custom. That is a choice, not a gap in the tool. A gap happens once a day at 09:15 whether you hold for five minutes or five weeks, so splitting the settings by trading style would be decoration rather than tuning.
Default carries what the year of testing settled on: a two-day window for the price gap, a 30-minute opening range, and a forecast lock at 09:10 IST. On slower charts that have no bar ending at 09:10, it falls back to the 09:00 bar on its own, so the same setting works at every chart speed.
Custom unlocks every setting, and each one opens on its Default value. Switching to Custom changes nothing until you actually edit something.
Only one setting has a real trade-off: the opening range. 30 minutes protects the read on small-gap fades. 15 minutes decides the day earlier and leaves far fewer undecided sessions. Both sides, with their day counts, are laid out in the user guide.
Dashboard
On the GIFT chart the dashboard walks you through the forecast step by step. It shows yesterday's close, the live GIFT price, the measured price gap, the likely open with its range, the expected gap and its size class, the number that was locked before the open, how far off the tool has been on average, and whether the forecast is live or paused.
On the NIFTY chart it shows today's gap and size class, the open against fair price, what the day is doing right now, how far price is from the halfway point and from yesterday's close, the opening range, and two history rows matched to today's gap size and first move.
Settings
You pick both symbols yourself, so the tool follows the exact tickers your data plan gives you. Under Custom you can set the price-gap window, the opening-range and cut-off times, the gap size cut-offs, how big a jump triggers the contract-change warning, the fair-price triggers, and the lock time. Every one of them opens on its Default value. Separate toggles turn the level map, gap zone, opening-range lines, fair-price line, labels, and coloured background on or off. The dashboard has its own position and text-size controls.
Alerts & Automation
- Normal alerts: forecast locked, how close the forecast was, expected gap flipped direction or grew a size class, open far from fair price, gap running, gap closing, halfway back, gap fully closed, bounce at yesterday's close, no direction
- Webhook alerts (optional): every event also goes out as a message in a fixed format your bot or journal can read — it carries the signal, which mode fired it, the ticker, the timeframe, the price, the preset, the forecast, the gap size, the price gap, the day state, the opening range, and how far the open was from fair price
- The far-from-fair-price alert fires at the open by design. Every other alert fires when a bar closes.
Access
This is an invite-only script. Request access via the Author's Instructions below this description.
Part of the DYNA Ecosystem
NIFTY Gap Forecast Engine is premium [DYNA Pro] tool. It is built alongside the free [DYNA] indicator suite and follows the same rules: plain language, nothing that changes after the fact, and honest ranges instead of single numbers.
Disclaimer
This indicator is a technical analysis tool for studying opening gaps. It is not financial advice. Everything it shows about past gaps describes history, not what will happen next. Trade at your own risk.