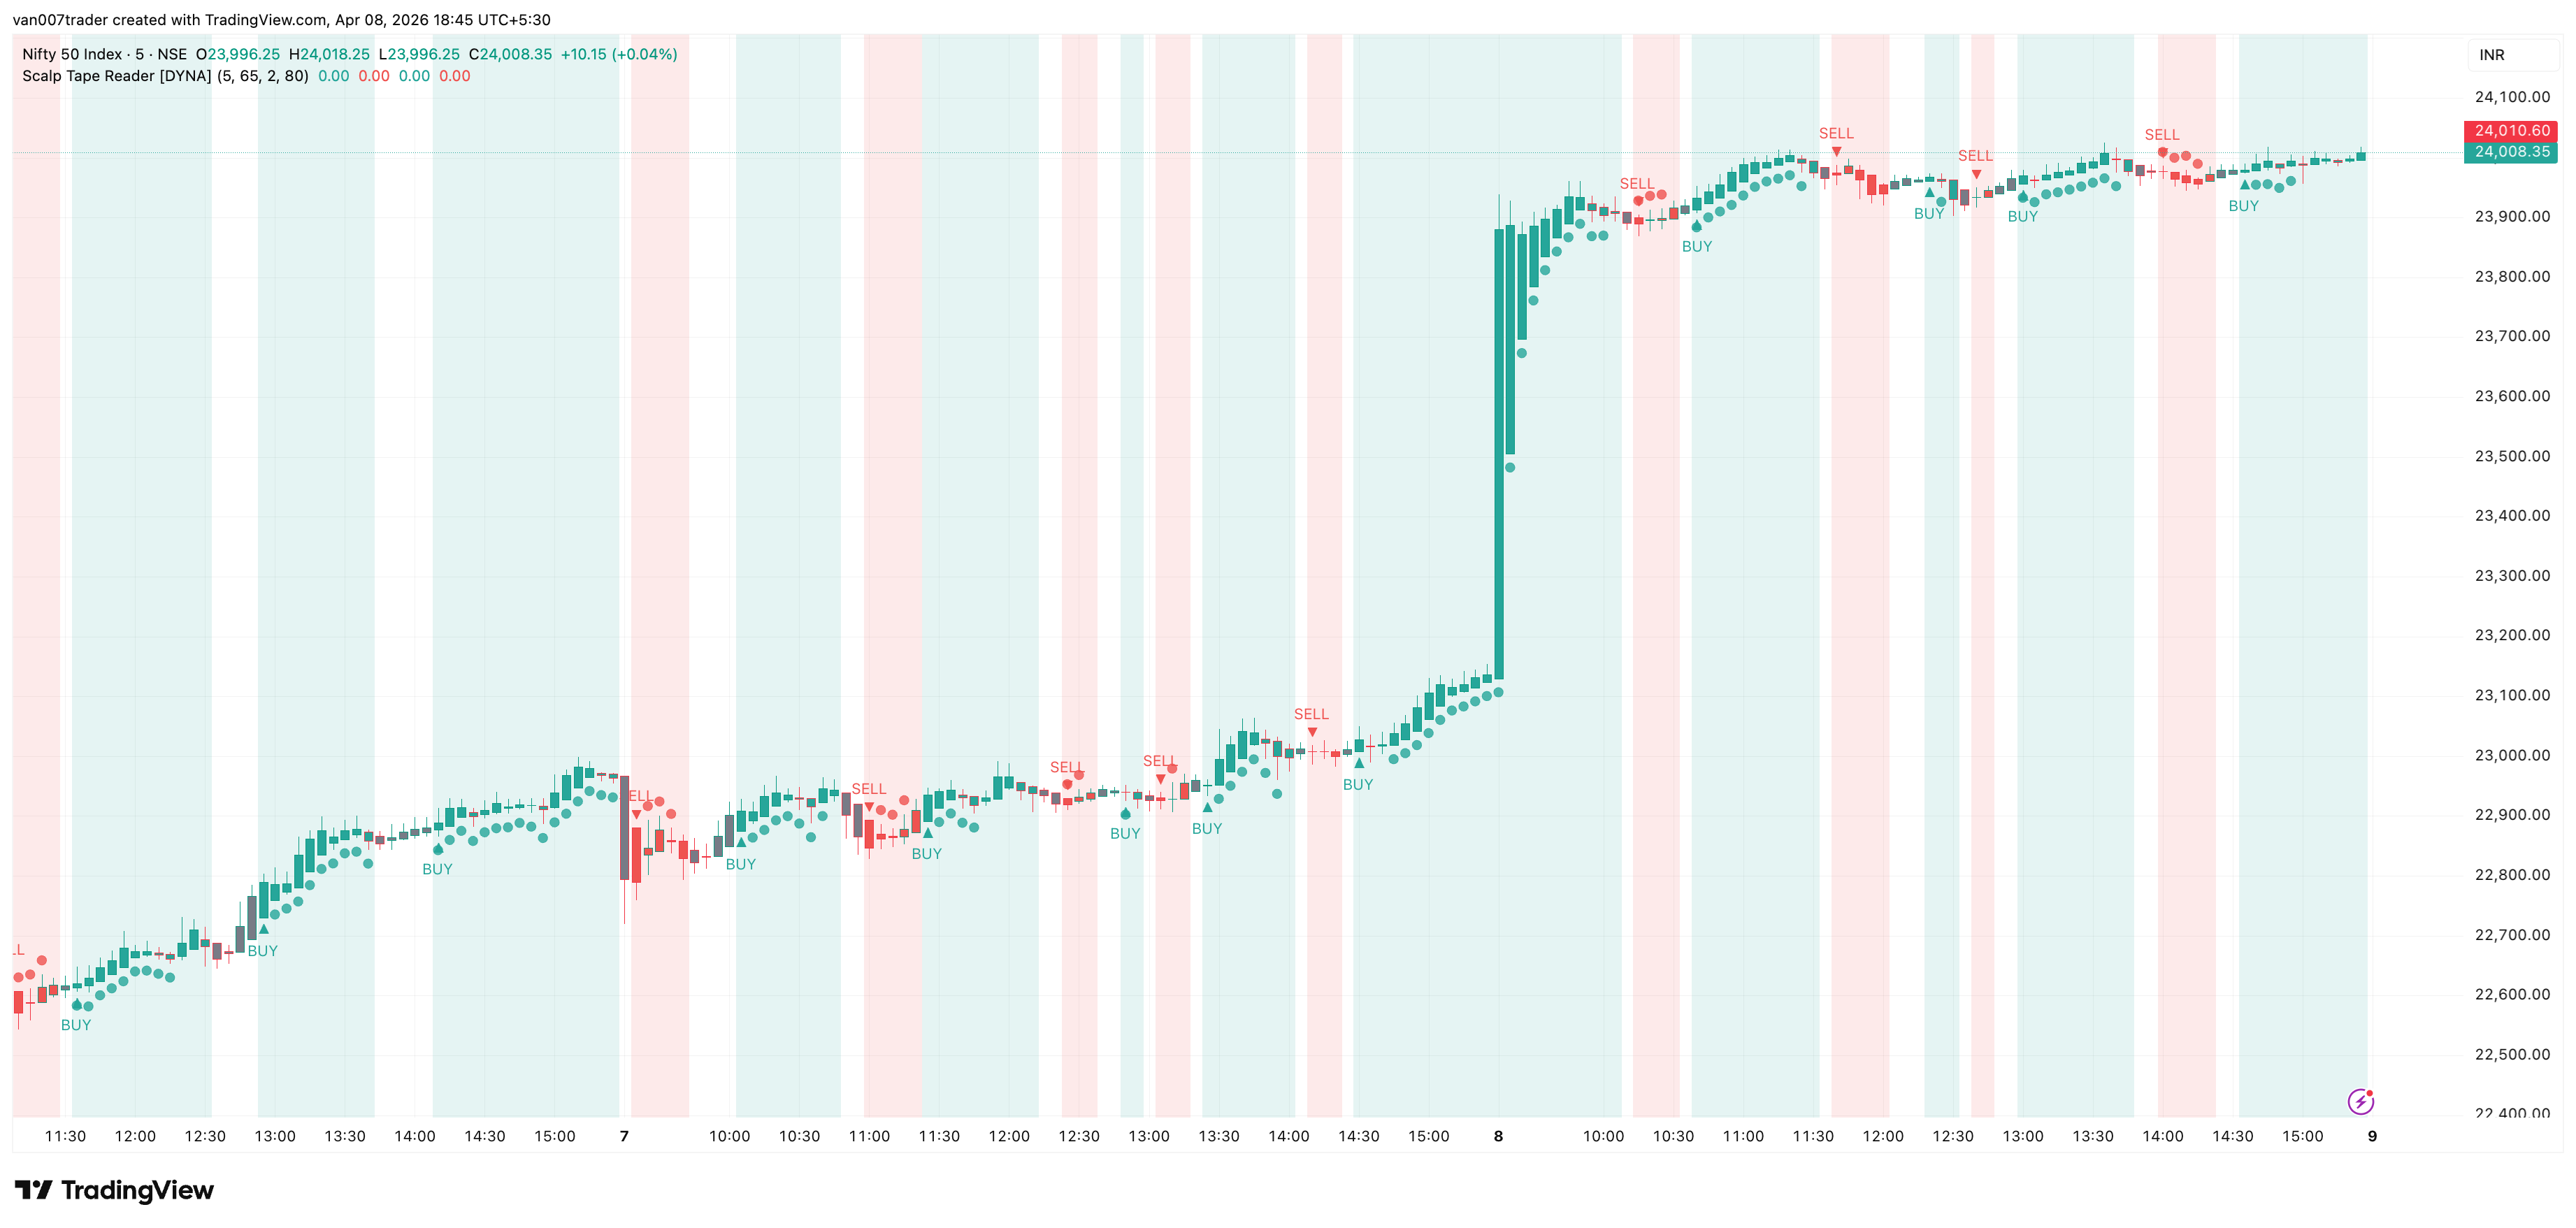
Scalp Tape Reader gives you an instant visual read on who is in control — buyers or sellers — by analyzing volume-weighted price action across a micro window. Instead of guessing from candlestick patterns or lagging oscillators, you see aggression directly on the chart through colored bars that tell you when one side is dominating the tape.
Most volume indicators sit in a separate pane and require interpretation. Scalp Tape Reader removes that friction. It weighs each bar's volume by its body-to-wick ratio — giving more significance to decisive, full-bodied candles and filtering out indecisive wicks and dojis — then checks whether buying or selling pressure exceeds your chosen dominance threshold. The result is clean, color-coded bars that let you act without thinking.
Key Features
- Volume-Weighted Pressure Detection — Combines volume with candle conviction (body-to-wick ratio) to separate real aggression from noise
- Instant Bar Coloring — Teal for buy pressure, red for sell pressure, gray for neutral. No separate pane, no mental math
- Background Pressure Zones — Subtle teal or red background shading during dominant pressure periods, making streaks visible even when zoomed out
- Dominance Flip Markers (debounced) — Triangle labels mark the exact bar where pressure shifts, with a 50% midline-cross debounce that suppresses repeat flips when dominance oscillates around the threshold
- Extreme Pressure Dots (entry-only) — Circle markers fire on the first bar that crosses into extreme dominance (default 80%+), so each dot is an independent event rather than one per bar in a streak
- Adjustable Sensitivity — Tune the lookback window, dominance threshold, and smoothing to match your trading style and timeframe
- Built-In Alerts — Get notified the moment buying or selling pressure crosses your threshold, even away from the screen
How It Works
As each bar forms, Scalp Tape Reader calculates how much of the bar's range is body versus wick. Bars where price moved decisively (large body, small wicks) receive a high conviction weight, while indecisive bars (dojis, long wicks) receive a low weight. This conviction weight is then multiplied by the bar's volume to produce a weighted volume reading for each side — buying if the bar closed above its open, selling if it closed below.
These weighted volumes are accumulated over the lookback window (default 5 bars) and compared. When buying pressure accounts for more than 70% of the total weighted volume, bars turn teal. When selling pressure exceeds 70%, bars turn red. Everything in between stays gray, telling you the market lacks a clear aggressor.
An EMA smoothing layer (default 3) prevents the reading from flickering between states on borderline bars, giving you a steadier signal without adding significant lag. Flip markers are further debounced by requiring dominance to cross back through the 50% midline before a new same-direction flip can fire, so you only see triangles on genuine regime changes. Extreme dots fire only on the first bar that crosses into the extreme zone, keeping the chart uncluttered during sustained pressure streaks.
Beyond bar coloring, the chart background shades teal or red during dominant pressure zones, so you can spot buying and selling streaks at a glance — even when zoomed out. When pressure flips from one side to the other, a triangle marker appears with a "BUY" or "SELL" label, pinpointing the exact transition bar. On the strongest bars — where one side holds more than 80% of weighted volume — small circle dots appear below (for extreme buying) or above (for extreme selling), highlighting the moments of peak conviction.
Settings
The default configuration works well for 1-5 minute scalping on crypto and equities. The Lookback Period (default 5) controls how many bars are used to accumulate pressure — lower values react faster, higher values smooth out noise. The Dominance Threshold (default 70%) sets how much weighted volume one side must hold to be flagged as dominant. Drop it to 60-65% on thinner or more volatile instruments; raise it to 75-80% if you only want the strongest signals.
Smoothing Period (default 3) applies an EMA to the dominance reading before thresholding. Set it to 1 for raw, unsmoothed readings. The "Color Bars by Pressure" toggle lets you disable bar coloring if you only want alerts. Note that TradingView allows only one barcolor indicator per chart — if bars are not coloring, check for conflicts with other indicators.
The Visual group also includes toggles for background pressure zones, dominance flip markers, and extreme pressure dots. The Extreme Pressure Threshold (default 80%) controls how strong the dominance must be to trigger the dot markers. All visual elements can be toggled independently so you can customize exactly what appears on your chart.
Alerts
- Buy Pressure Dominant — Fires when buying-side weighted volume exceeds the dominance threshold on a confirmed bar. "Scalp Tape Reader [DYNA]: Aggressive buying pressure detected."
- Sell Pressure Dominant — Fires when selling-side weighted volume exceeds the dominance threshold on a confirmed bar. "Scalp Tape Reader [DYNA]: Aggressive selling pressure detected."
To set up alerts: click the TradingView Alerts button, select "Scalp Tape Reader [DYNA]" from the indicator dropdown, choose "Any alert() function call" as the condition, and set your preferred notification method.
Best Practices
- Use on low timeframes (1m to 5m) where volume-driven pressure shifts are most visible. Higher timeframes dilute the signal.
- Look for clusters of colored bars rather than single-bar flashes. A streak of teal bars is a stronger signal than one isolated teal bar.
- Combine with support/resistance levels or your existing entry strategy. Use the tape reading as a confirmation filter, not a standalone signal.
- Volume quality matters — prefer instruments and brokers that provide real volume data. Tick volume works but real volume is better.
- If signals feel too noisy, raise the threshold to 75% or increase the lookback. If they feel too slow, drop the lookback to 3 and set smoothing to 1. The defaults (70%, smoothing 3) are tuned for balanced signal density on liquid instruments such as indices and major pairs.
Part of the DYNA Ecosystem
Scalp Tape Reader is a free indicator built with the same design standards as the DYNA premium suite. For complete trade management with automatic stop loss, break-even, trailing stops, and multi-target systems, explore the full DYNA indicator collection.
Disclaimer
This indicator is a technical analysis and educational tool only — it is not financial advice and makes no guarantee of any outcome. Past performance does not predict future results. Always do your own research and use proper position sizing and risk management.