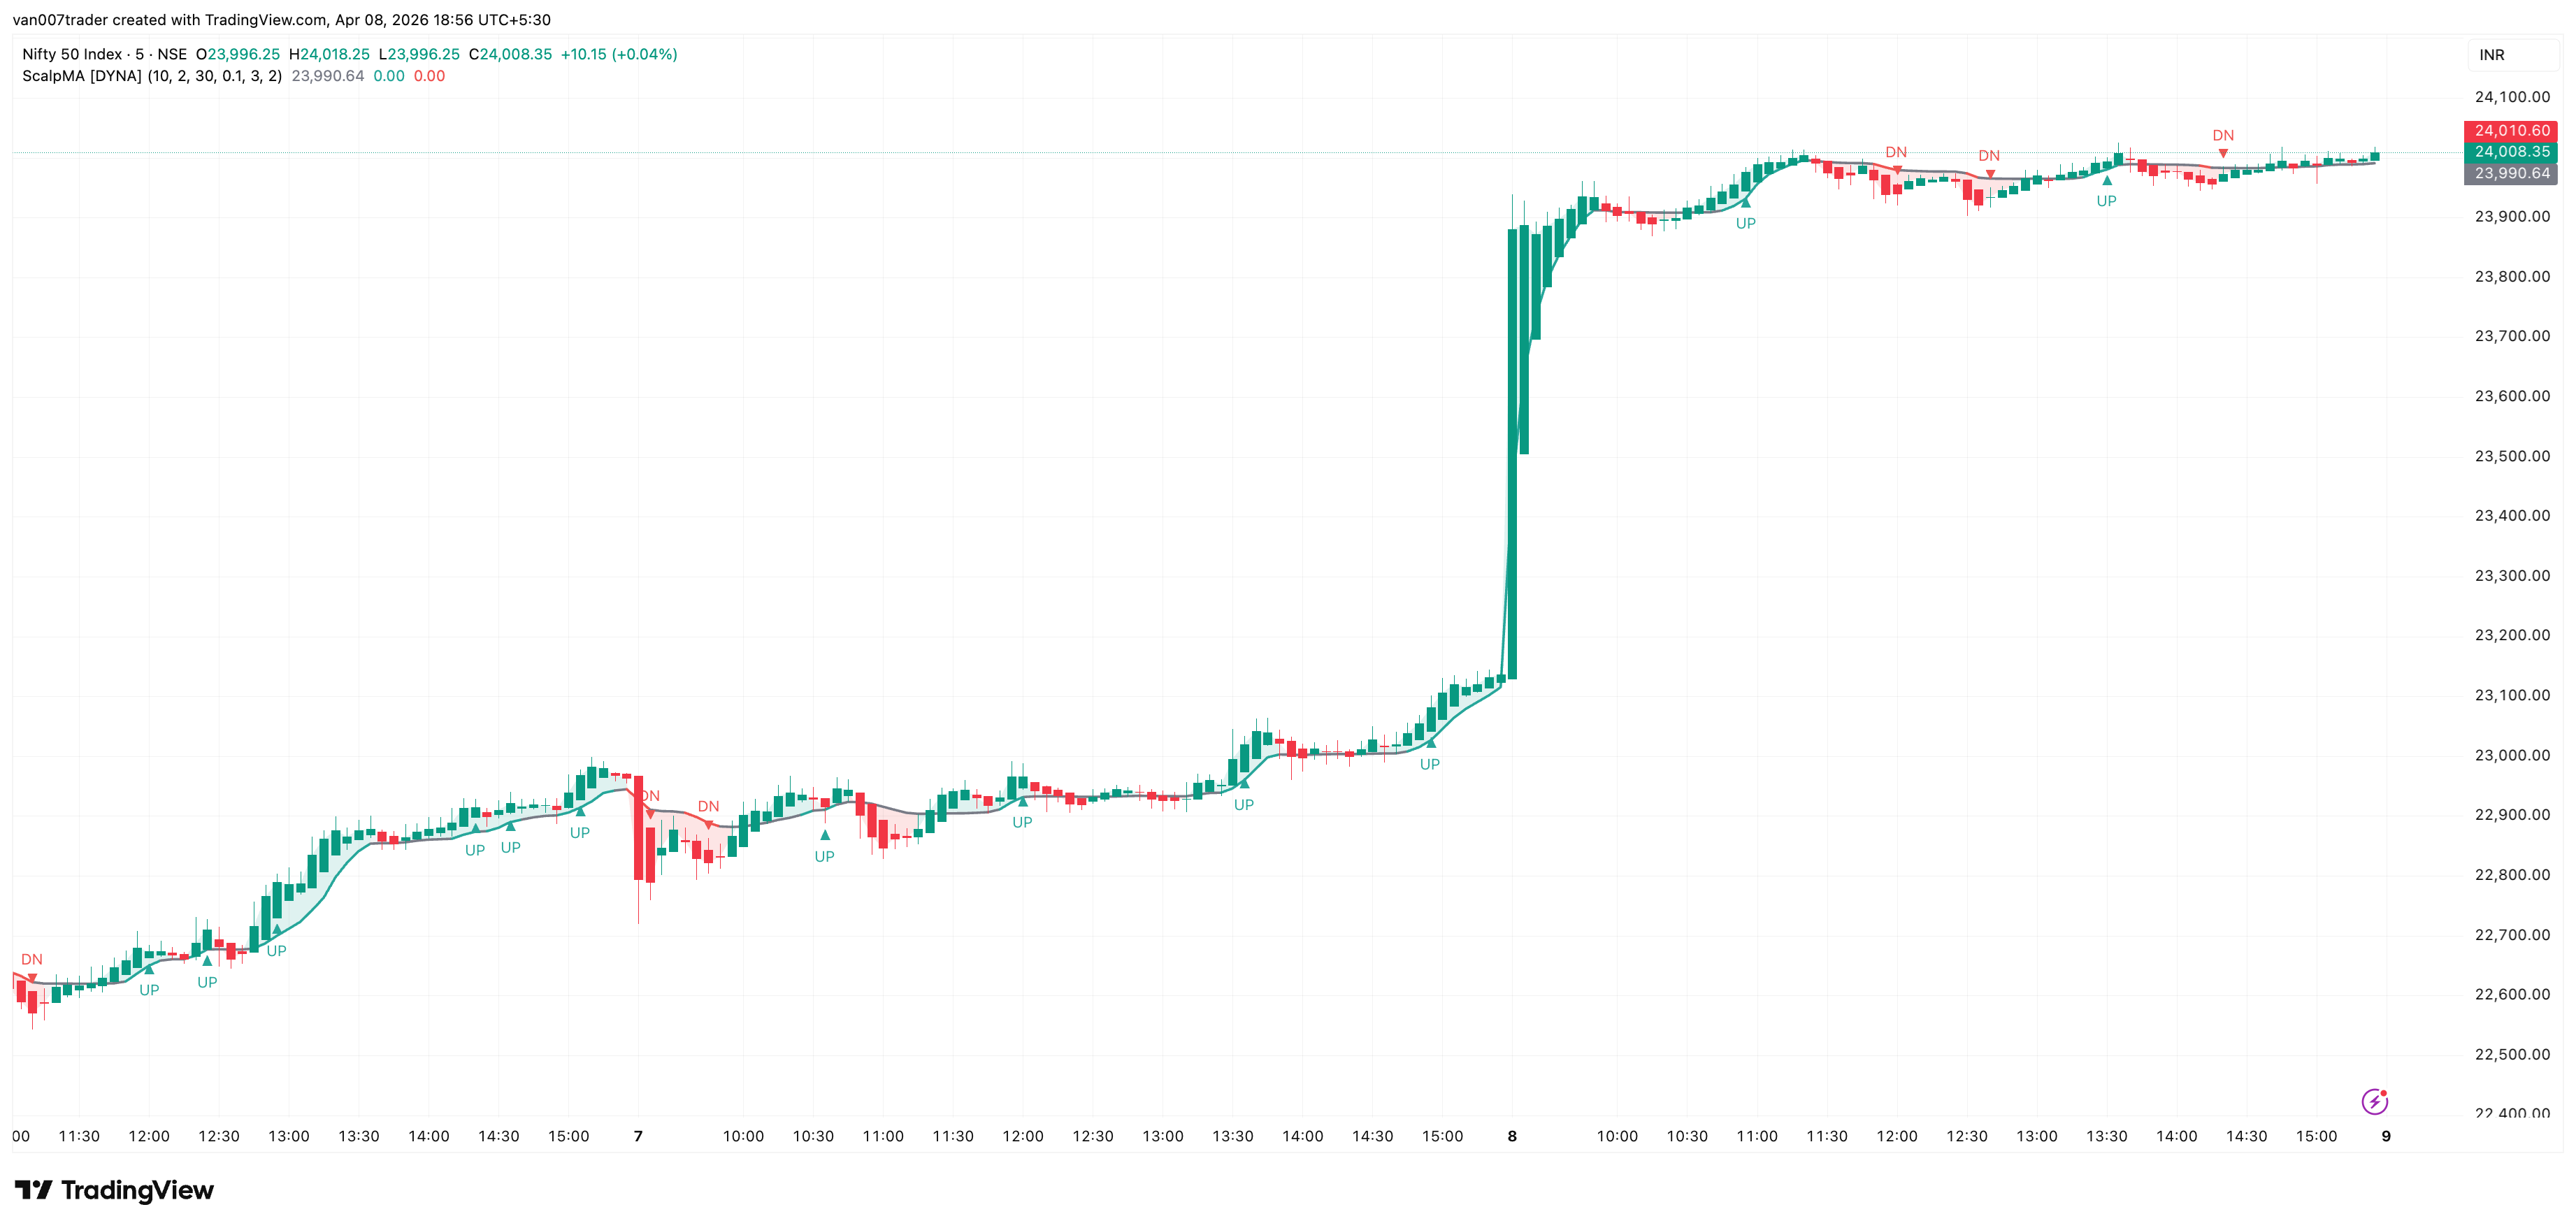
Scalper's Moving Average is an adaptive overlay line that automatically adjusts its speed based on market conditions. In trending markets it tracks price closely, keeping you in the move. In choppy, sideways markets it flattens out, filtering noise and keeping you from getting whipsawed. It is built on the Kaufman Adaptive Moving Average (KAMA) algorithm, tuned specifically for 1-5 minute scalping charts.
Most moving averages force you to choose between speed and smoothness. A fast MA gives early signals but generates constant false flips in chop. A slow MA filters noise but lags behind real moves, costing you ticks on every entry. Scalper's Moving Average solves this tradeoff by measuring how efficiently price is moving and adjusting its responsiveness in real time.
Key Features
- Adaptive Speed — Automatically speeds up when price is trending and slows down when the market is chopping, so you get one line that does the work of two
- Slope Color Coding — The KAMA line changes color based on its slope direction: teal for rising, red for falling, gray for flat. Instant visual read of trend bias
- Distance Fill — Optional shaded area between price and KAMA shows how far price has stretched from its adaptive mean, helping you spot overextension and pullback entries
- Slope Flip Markers — Small triangle markers appear on the chart when the KAMA slope changes direction, flagging potential trend shifts at a glance. An ATR-based filter and cooldown system suppress noise flips in choppy markets
- No Repainting — Slope flip signals use confirmed-bar logic and will not change once printed
How It Works
When you add the indicator to your chart, you will see a single colored line overlaid on your candles. This is the KAMA line. Unlike a standard EMA or SMA, it does not move at a fixed speed. Instead, it calculates an efficiency ratio on every bar — comparing how far price has moved in one direction versus how much total back-and-forth movement occurred. When that ratio is high (strong trend), the line speeds up and hugs price closely. When the ratio is low (chop), the line barely moves.
The line color tells you the current slope direction at a glance. A teal line means KAMA is rising and momentum favors the bulls. A red line means KAMA is falling and momentum favors the bears. A gray line means the slope is flat and the market has no clear direction — a signal to stay patient.
When the slope changes direction, a small triangle marker appears directly on the KAMA line. An "UP" triangle marks a bullish flip, and a "DN" triangle marks a bearish flip. These transitions are the earliest indication that the adaptive trend bias has shifted. To keep the chart clean, flips are filtered by an ATR-scaled minimum slope threshold — tiny wiggles in chop are ignored — and a cooldown period prevents rapid-fire labels from stacking up.
Distance Fill
The optional distance fill shades the area between the close price and the KAMA line. When price is above KAMA the fill is teal; when below, the fill is red. When price is hugging KAMA closely (within the dead-zone threshold), the fill turns neutral gray, giving you an instant visual cue that the market is chopping and there is no meaningful stretch to trade. The width of the colored fill tells you how far price has stretched from its adaptive mean. A wide fill suggests the move may be overextended — not the ideal time to chase. A narrowing fill as price pulls back toward KAMA can highlight better entry zones where risk-to-reward improves.
Settings
The core settings control the KAMA calculation. KAMA Length (default 10) sets the lookback window for the efficiency ratio — lower values make the line more reactive, higher values smooth it out. Fast Constant (default 2) determines the fastest the line can move when the trend is strong. Slow Constant (default 30) determines how sluggish the line becomes in chop. The defaults are tuned for 1-3 minute charts and work well for most scalping scenarios.
The flip filter settings control label quality. Min Slope (ATR %) (default 0.15) sets the minimum slope magnitude as a fraction of ATR — raise it to filter out more noise flips in choppy conditions. Cooldown Bars (default 5) enforces a minimum gap between flip labels, preventing clusters of rapid UP/DN markers. Both settings also define the neutral dead-zone for slope coloring and fill.
Under visual settings, you can toggle the distance fill on or off and adjust the KAMA line thickness.
Alerts
- Slope Flip Bullish — Fires when the KAMA slope turns from flat or falling to rising. Message: "Scalper's Moving Average [DYNA]: KAMA slope flipped bullish. Trend may be turning up."
- Slope Flip Bearish — Fires when the KAMA slope turns from flat or rising to falling. Message: "Scalper's Moving Average [DYNA]: KAMA slope flipped bearish. Trend may be turning down."
To set up alerts: click the TradingView Alerts button, select "Scalper's Moving Average [DYNA]" from the indicator dropdown, choose "Any alert() function call" as the condition, and set your preferred notification method.
Best Practices
- Start with the default 10/2/30 settings on 1-3 minute charts before making adjustments
- When the KAMA line is flat and gray, avoid trend-following trades — the market is chopping
- Use the distance fill to time entries: enter on pullbacks toward KAMA rather than chasing extended moves
- Combine slope flip signals with volume or support/resistance levels for higher-confidence entries
- If trading 5-minute charts, consider increasing KAMA Length to 14 or 20 for smoother signals
Part of the DYNA Ecosystem
Scalper's Moving Average is a free indicator built with the same design standards as the DYNA premium suite. For complete trade management with automatic stop loss, break-even, trailing stops, and multi-target systems, explore the full DYNA indicator collection.
Disclaimer
This indicator is a technical analysis and educational tool only — it is not financial advice and makes no guarantee of any outcome. Past performance does not predict future results. Always do your own research and use proper position sizing and risk management.