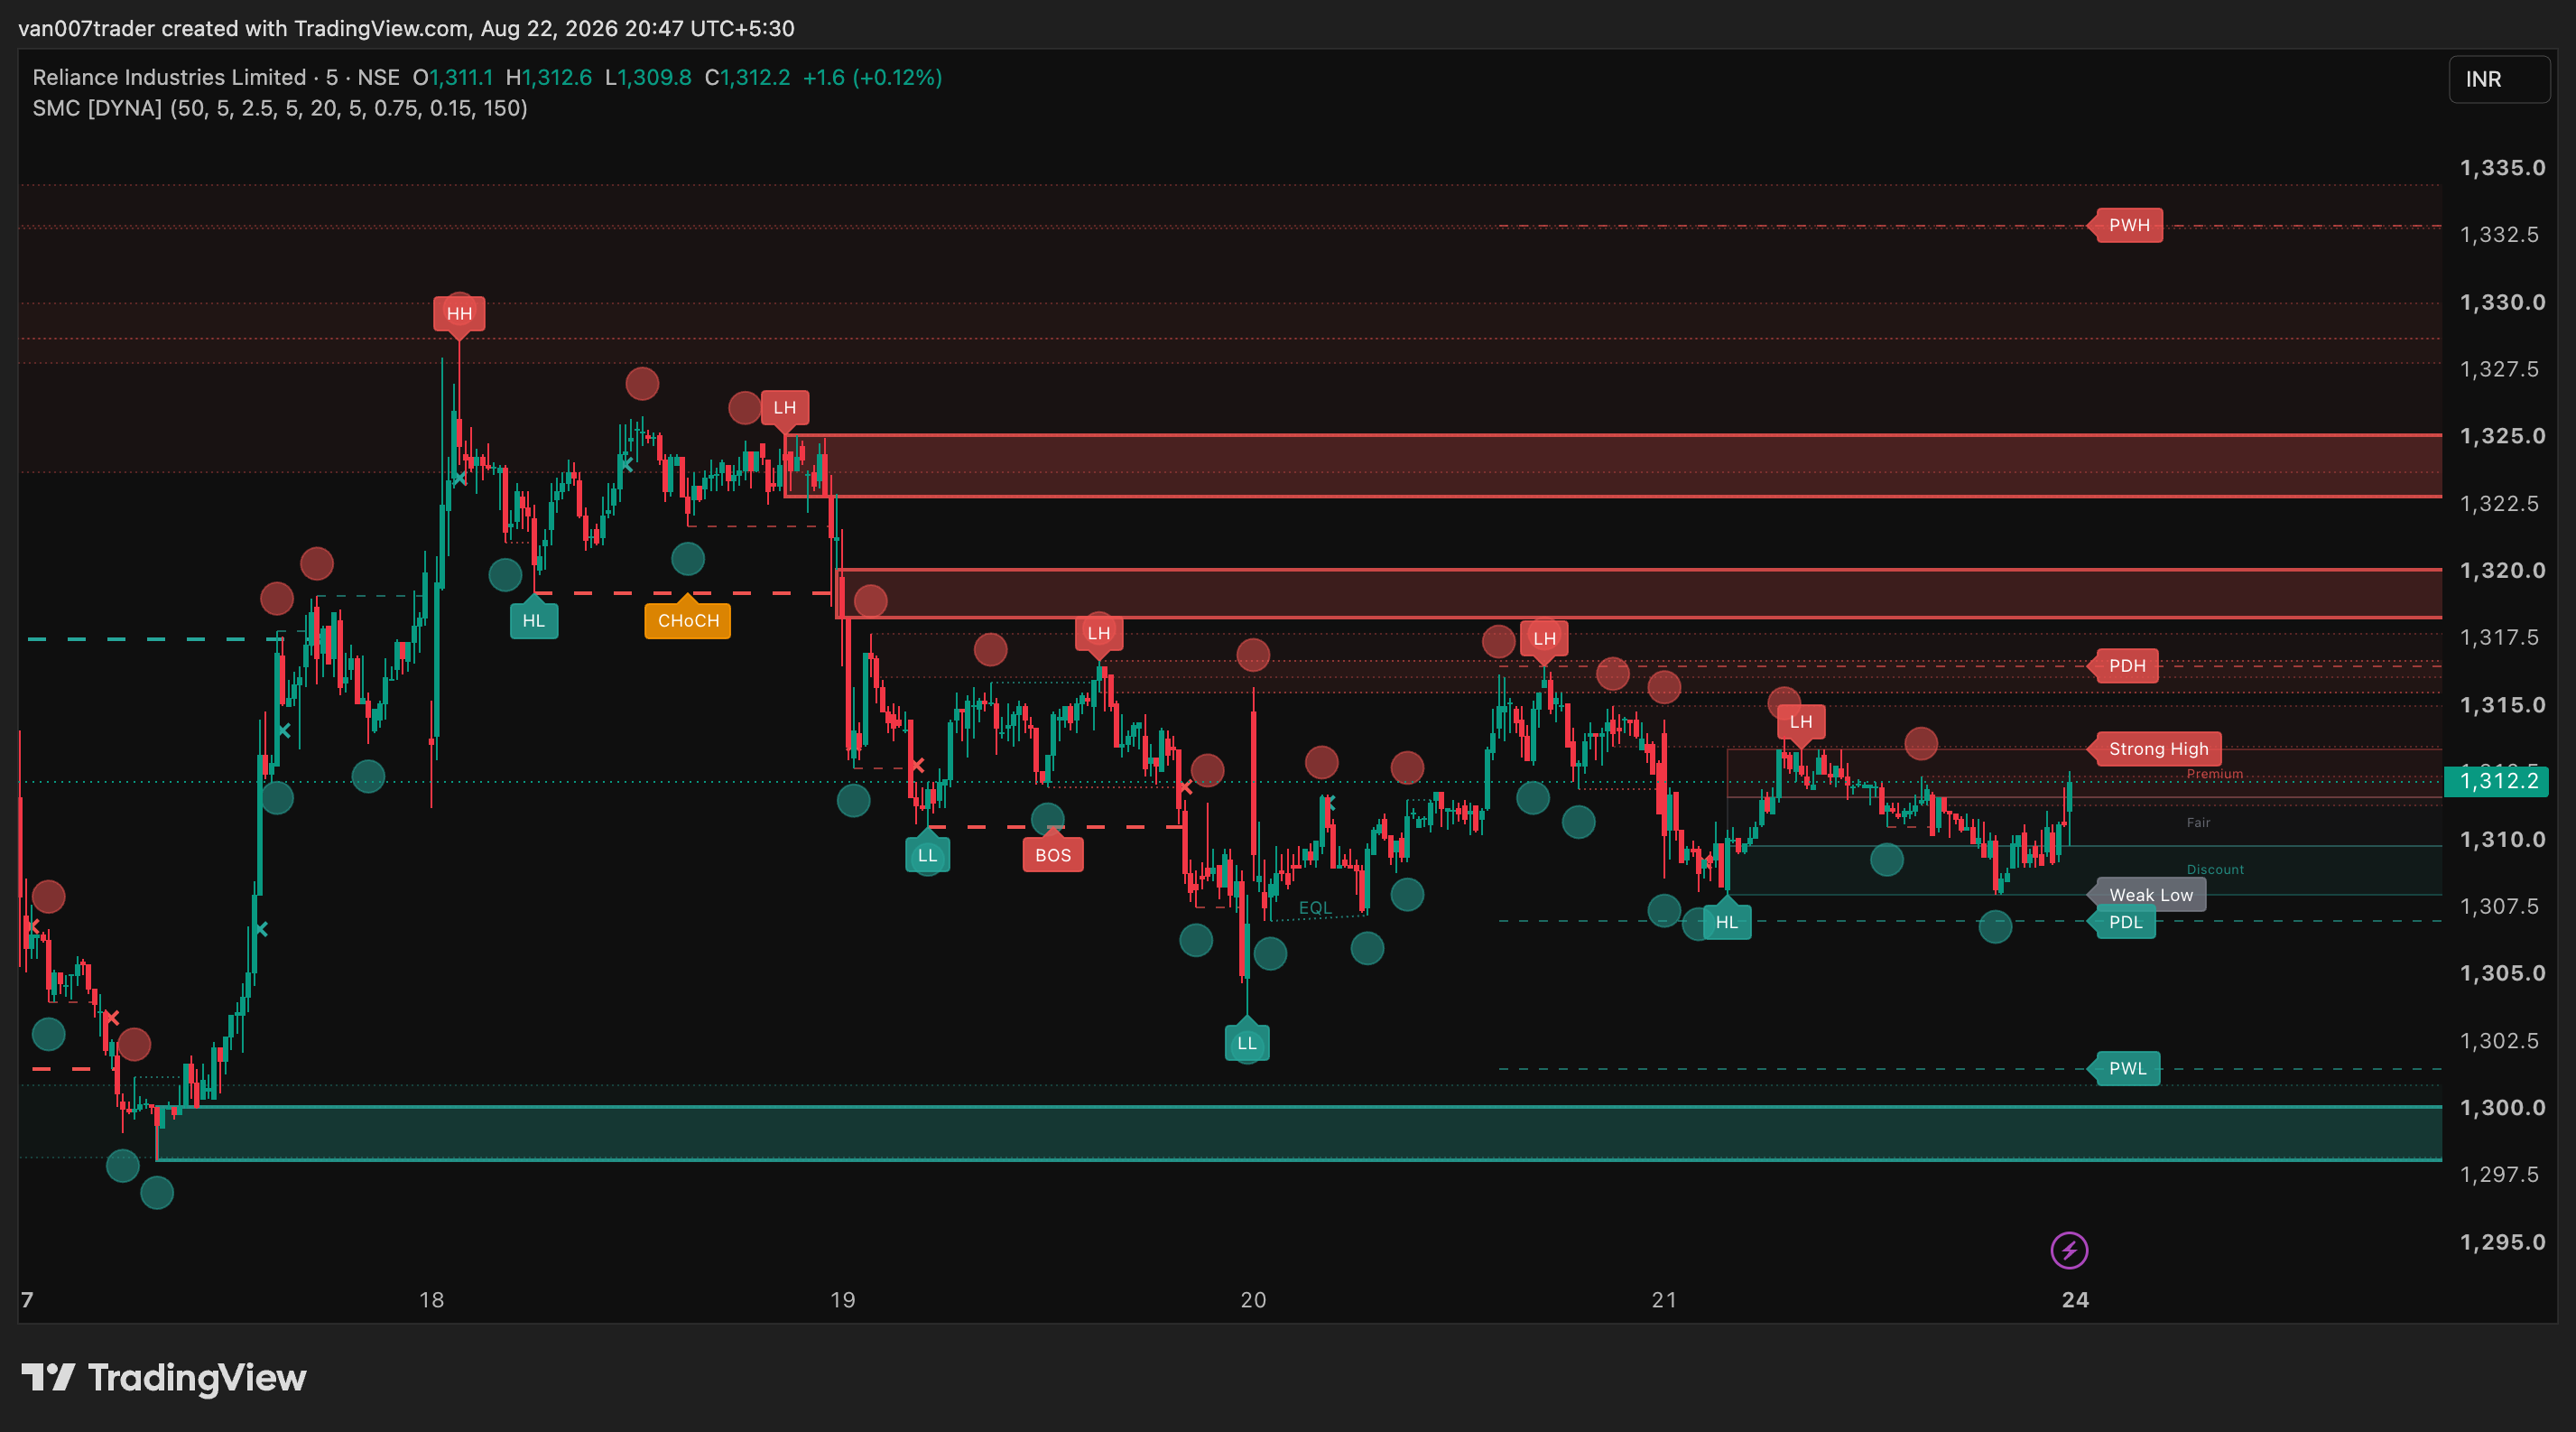
Smart Money Concepts draws the shape of the market on your chart. It finds the turning points that build the trend, marks the moment one of them is broken, and leaves boxes on the candles that pushed price away — the places price tends to come back to.
It does not give entries. It is a map, not a signal service. What it gives you is a chart where the structure is already drawn: which way the market is leaning, where the untested zones sit above and below you, and whether the last break carried the trend on or turned it around.
Everything is built from closed candles. A mark appears once and never moves.
Key Features
- Two structure streams at once — a big-picture stream and a detail stream, each with its own turns and breaks
- BOS and CHoCH labelling, so you can see at a glance whether the trend continued or changed character
- Order blocks with a full lifecycle: fresh, touched, then gone when price closes past them or they age out
- Fair value gaps on the same lifecycle, filtered by size in ATR so tiny gaps do not clutter the chart
- Equal highs and lows, premium and discount bands, strong and weak range ends
- Previous day, week and month high and low, each hidden on a chart that is already that big
- Ten built-in alerts
How It Works
The turning-point engine does not use a fixed-lookback pivot. It settles one side of the market at a time. It accepts a turn only after the market has moved on from it, and only when the swing is big enough to matter, measured in ATR. Because it settles one side and then switches to the other, highs and lows always alternate. That is what makes higher high, lower high, higher low and lower low a reliable read rather than an ordering guess.
Two of these run side by side at different lengths. The long one draws the trend; the short one draws the detail inside it. Both lengths shrink automatically as the chart timeframe rises, so a daily chart does not need different settings from a 5-minute chart.
A break is a close through the most recent confirmed turn on the other side — a close, not a wick. If it agrees with the current lean it is a Break of Structure. If it disagrees it is a Change of Character, and the lean flips. While a level waits to be broken, the engine keeps track of the last candle that traded against the eventual break direction. That candle becomes the order block when the break lands.
Every zone — order block or fair value gap — then lives one life. It starts fresh. The first time price trades into it, it fades and its edge turns dotted, so a tested zone is never confused with an untouched one. It is retired once price has closed past it, or once it has simply grown too old to matter. Zones far from current price are hidden rather than deleted, so the chart stays about today without losing the history.
The previous day, week and month levels are read from the last finished period, offset by one bar, which is the pattern that never repaints and never sees ahead.
Settings
Every drawing has its own switch, so the chart can be as full or as sparse as you want. Structure lengths, the smallest swing that counts, the smallest gap that counts, how close two turns must be to count as equal, how many zones to keep per side, how long a zone may live and how far from price it may sit before it is hidden are all adjustable. A history limit controls how many past marks are kept, so the platform's own drawing cap never silently deletes recent work.
Alerts
- Big-picture break up and down
- Detail break up and down
- Block above price broken, block below price broken
- Gap above price filled, gap below price filled
- Equal highs, equal lows
Best Practices
- Start with the big-picture stream only. Detail turns and detail blocks ship off for a reason — turn them on once the chart reads easily.
- Raise the smallest swing setting to quieten a noisy chart. It changes what you see more than any other setting.
- Treat a faded, dotted box as a used zone, not a dead one. The fade exists so you never have to remember which boxes price already visited.
- On a daily chart, raise the block age limit. At the default the clock retires about as many zones as price does.
- Read the last break first. BOS means the trend carried on. CHoCH means it turned.
Part of the DYNA Ecosystem
Smart Money Concepts is a free indicator built with the same design standards as the DYNA premium suite.
Disclaimer
This is a technical analysis tool, not financial advice. It marks market structure from past price. It does not predict price and makes no claim about outcomes. Trading carries risk and every decision you take with it is your own.