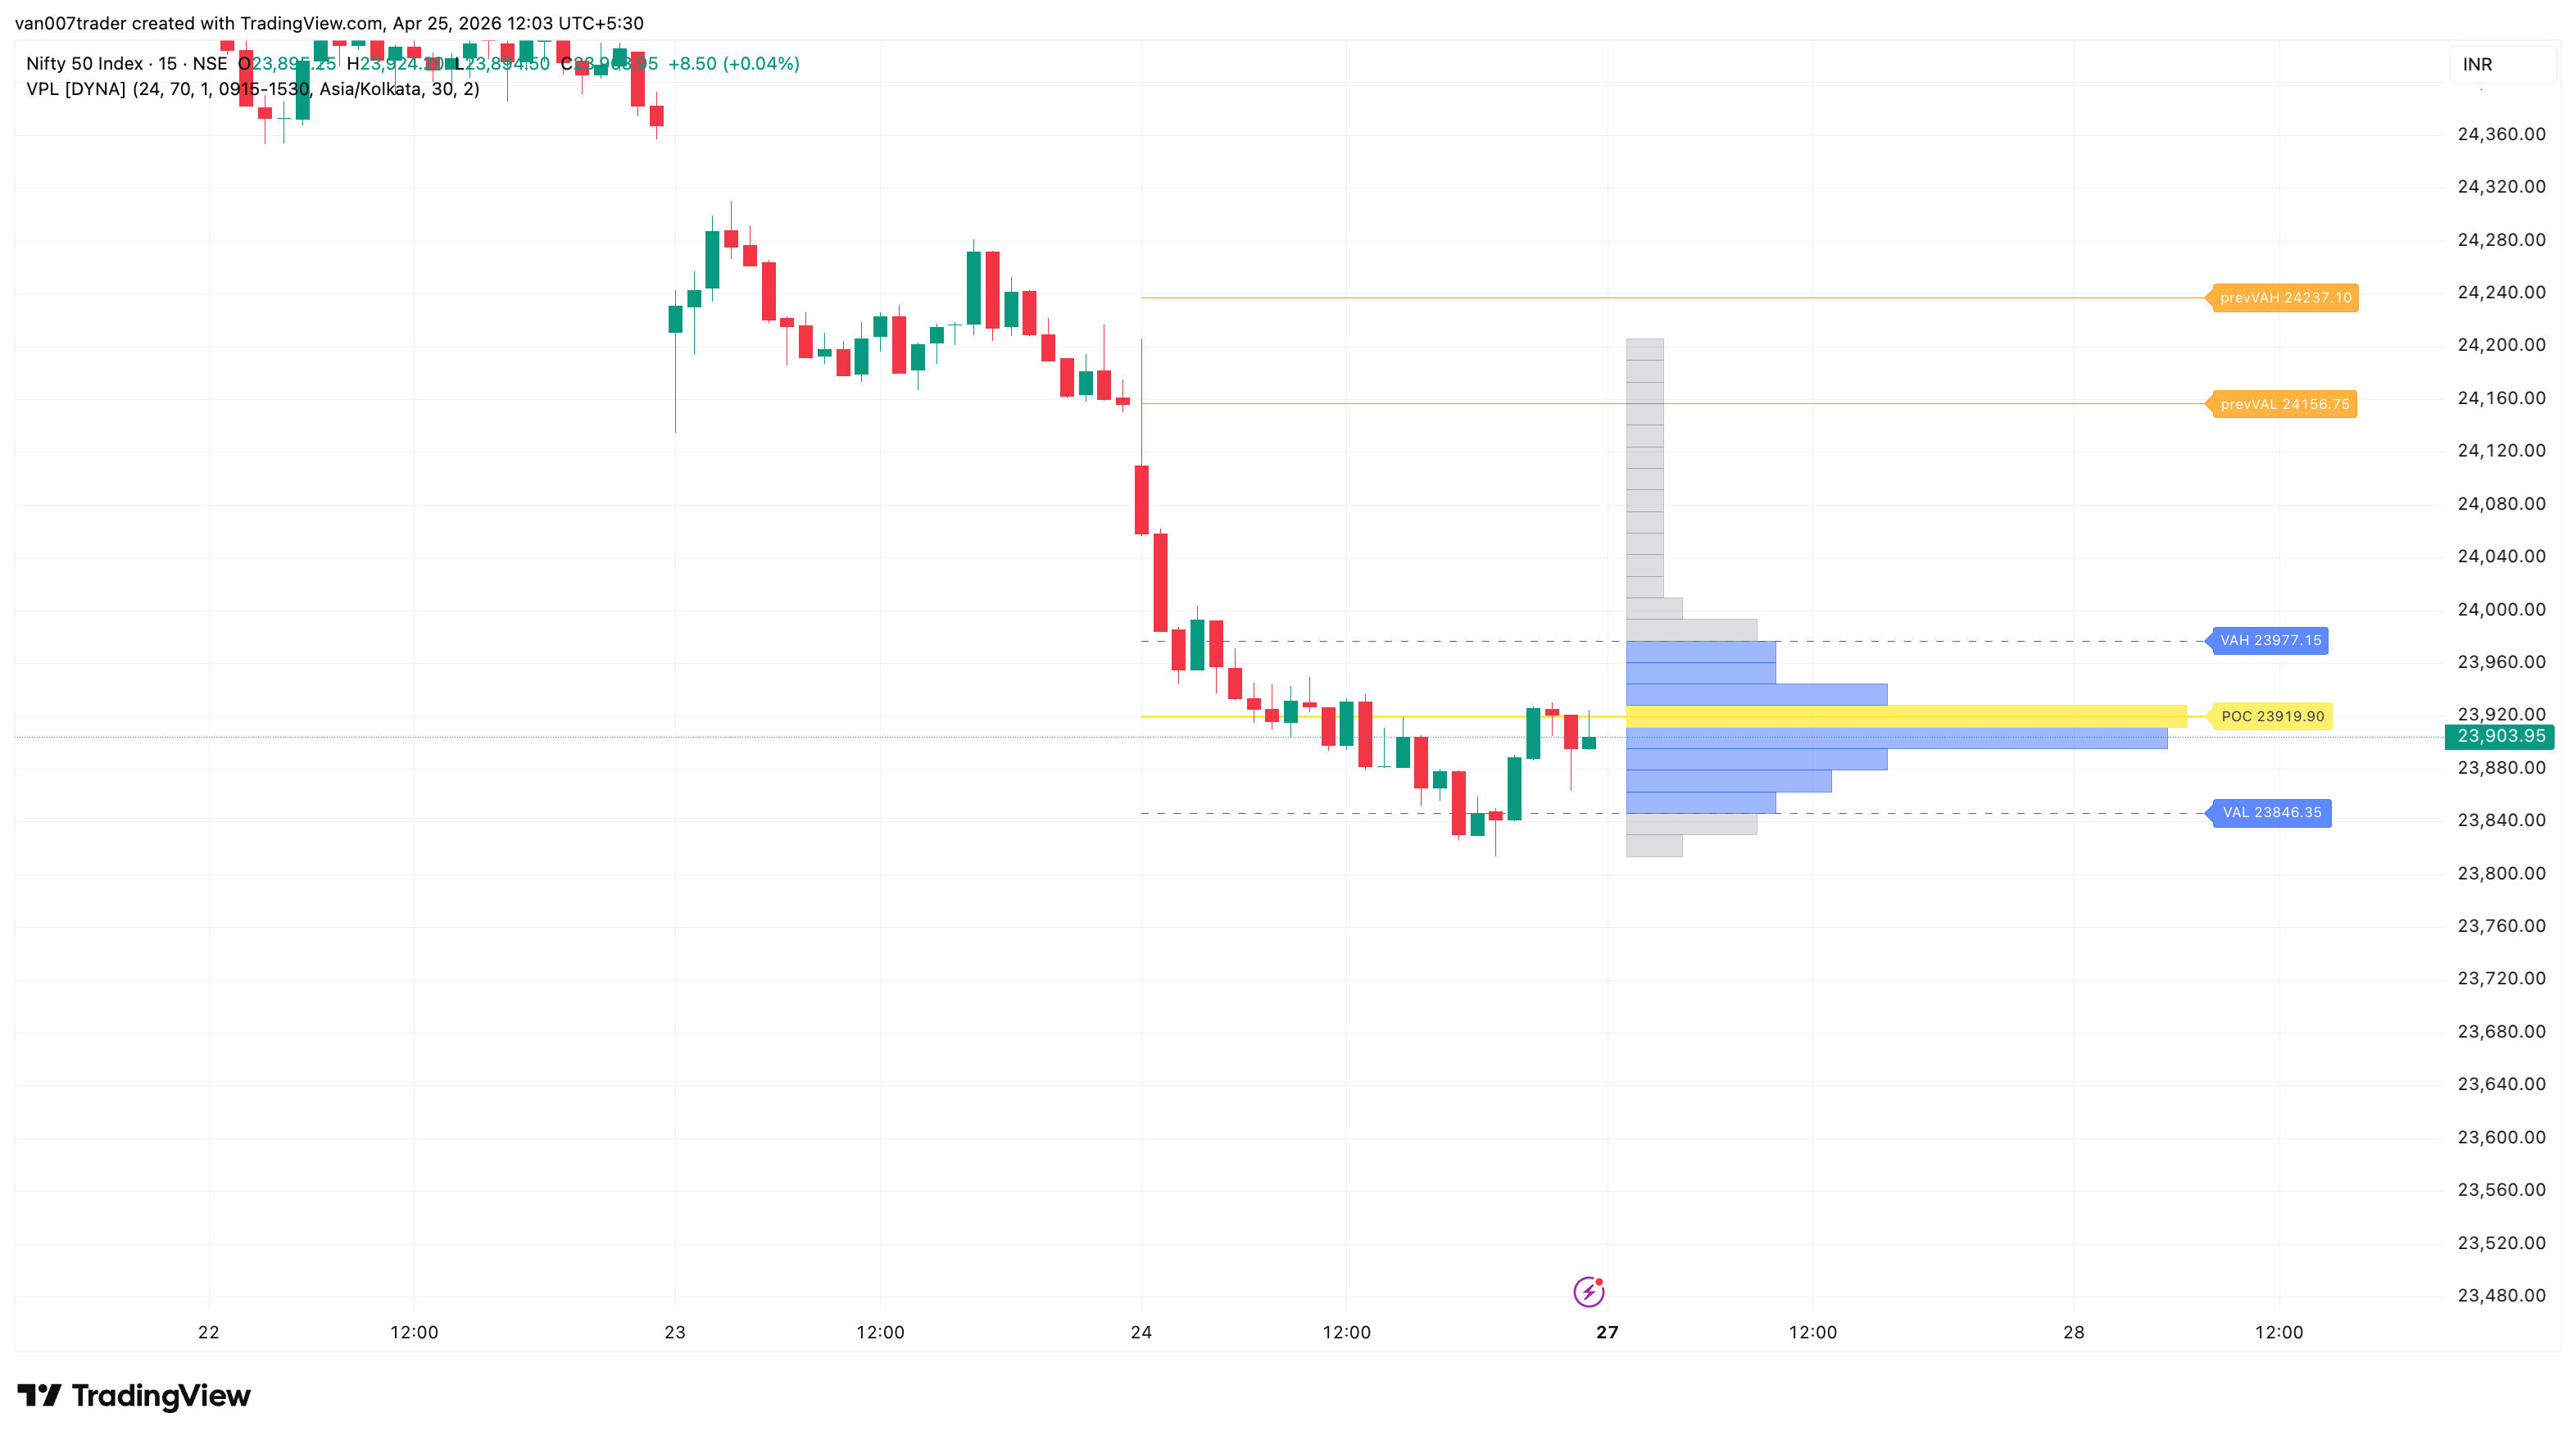
Volume Profile Lite shows where most of the trading happened during a session. It slices the session range into a row of horizontal bins, drops each bar's volume into the bins it touches, and draws the result as a horizontal histogram on the right side of the chart. The longest bar is the point of control (POC) — the single price level with the most accumulated volume — and the contiguous group of bins around the POC that together hold a configurable percentage of the day's volume (70% by default) is the value area.
Two pairs of horizontal levels are drawn. Today's developing VAH and VAL (blue dashed) bracket the live value area as it builds throughout the session. The previous session's end-of-day VAH and VAL (orange solid) are persisted as a stable reference — a close above prevVAH or below prevVAL is the canonical market-profile breakout signal: today is finding new acceptance outside yesterday's accepted range. Built-in alerts fire on the first such close per direction per session.
A "lite" volume profile by design: one anchor (the session), one profile, five levels (POC, VAH, VAL, prevVAH, prevVAL), two alerts. Configurable bin count, value-area %, lookback sessions, session window, and timezone. No repainting — POC and VA evolve as new volume arrives but never look back to change historical values.
Key Features
- Session-Anchored Profile — A fresh horizontal volume histogram is built for every trading session. Resets at the configured session boundary; the previous session's profile drops off cleanly when the new one begins.
- POC + Value Area — The point of control (highest-volume price) is highlighted in yellow with a dedicated line; bins inside the value area are shaded blue, bins outside are dimmer grey. The 70% value-area threshold is configurable from 50% to 95%.
- Configurable Bin Count — 24 bins by default. Raise to 36-50 for high-resolution profiles on wide-range days; drop to 12-16 for compact charts. Bin count caps at 50 to keep recompute time bounded.
- Multi-Session Lookback — Default 1 session shows today's profile. Raise to 3-5 to combine the last few days into a single composite profile — useful for swing context on intraday timeframes when daily randomness obscures the dominant POC.
- Right-Edge Histogram + Cross-Session Levels — The histogram sits to the right of the latest bar (offset and width are configurable). POC, VAH, VAL, prevVAH, and prevVAL lines extend leftward across the session range so they're visible as price-action levels, with right-edge labels showing the exact prices.
- Stable Breakout Reference — Yesterday's end-of-day VAH and VAL are locked in at session open and shown as orange solid lines. These — not today's evolving VAH/VAL — are the alert reference, which gives a clean, non-shifting breakout signal instead of the noisy "live cross" produced by an expanding live profile.
- One-Shot Breakout Alerts — Two latched alerts fire on the first close above prevVAH or below prevVAL in each session. One alert per direction per day — no spam from re-crosses.
- No Repainting — All computation happens on confirmed bars. POC, VAH, and VAL evolve as new volume enters but never retroactively change. Breakout alerts only fire after a closed bar.
How It Works
The indicator maintains a rolling buffer of every bar inside the configured session window for the last N sessions (N = lookback). On each confirmed bar, the buffer's full price range is split into the configured number of bins, and every bar's volume is distributed across the bins it overlaps — proportional to how much of the bar's high-low range falls inside each bin. Zero-range bars deposit their full volume into the single bin containing them.
The bin with the largest accumulated volume becomes the POC. The value area then expands outward from the POC one bin at a time, always taking the side (above or below) with the greater immediate volume, until the cumulative volume inside the area reaches the configured value-area percent of the session total. The top of the highest included bin is VAH, the bottom of the lowest included bin is VAL.
At every new session boundary the indicator captures the previous session's final VAH and VAL and locks them in as prevVAH/prevVAL — the alert reference. Today's developing VAH/VAL are visualized but intentionally not used for alerts: a live volume profile's value area expands as the session unfolds, which makes "live cross" alerts extremely noisy. Yesterday's end-of-day VAH/VAL is fixed and stable, and a close beyond it is the canonical "today is finding new acceptance outside yesterday's range" signal.
For instruments with no published volume (e.g., some cash indices), the indicator falls back to a flat per-bar weight of 1.0. This produces a bar-count "TPO-style" profile rather than a true volume profile — the shapes and POC location still reflect where price spent the most time and remain useful as structural reference.
Each confirmed bar redraws the histogram boxes and all five level lines (POC, VAH, VAL, prevVAH, prevVAL) from scratch using fresh data. Two alert conditions watch for a close above prevVAH and a close below prevVAL respectively; each latches after firing and only resets at the next session boundary.
Settings
Number of Bins (default: 24, range 8-50) controls the granularity of the profile. 24 bins on a typical session range produces readable, evenly sized bins, which is a good balance. Raise toward 50 for wide-range trending days where you want fine-grained POC location; drop to 12-16 for compact charts.
Value Area % (default: 70.0, range 50-95) is the cumulative-volume threshold that defines the value area. 70% is the market-profile textbook standard. Lower values produce a tighter "core" with sharper VAH/VAL fade signals; higher values produce a wider band more like an outer envelope.
Lookback Sessions (default: 1, range 1-5) sets how many trailing sessions are merged into a single profile. 1 = today only (the standard intraday view). Raising to 3-5 produces a composite multi-session profile that smooths daily randomness — useful when you want the dominant POC across a recent range rather than just today's.
Session Time (default: 0915-1530) and Timezone (default: Asia/Kolkata) define the session window. Adjust both to match the regular trading hours of your instrument and exchange.
The visual section (Show Histogram, Histogram Width (bars), Histogram Offset (bars), Show POC Line, Show Value Area Lines, Show Previous Session VAH/VAL, Extend POC/VA Across Session, Show Price Labels) controls the layout. Width and offset are pure layout knobs and do not change any signal — if the histogram overlaps price, increase the offset; if it's too narrow to read, increase the width. The two alert toggles enable or disable the prevVAH-break and prevVAL-break alerts independently.
Alerts
- Break Above Previous VAH — Fires on the first close above the previous session's VAH. "Volume Profile Lite [DYNA]: Price closed above the previous session's value area high."
- Break Below Previous VAL — Fires on the first close below the previous session's VAL. "Volume Profile Lite [DYNA]: Price closed below the previous session's value area low."
To configure: open TradingView's Alerts panel, choose "Volume Profile Lite [DYNA]" from the condition dropdown, pick the desired alert type, and select your notification channel. Each alert latches once per session per direction; you cannot get a flood of repeat triggers from price oscillating around a level.
Best Practices
- Use intraday timeframes (5m, 15m, 30m, 1h). The profile needs 30-100+ bars per session to resolve a meaningful distribution. Avoid daily charts.
- The orange prevVAH/prevVAL lines are the breakout reference. A close above prevVAH on the open says "today is accepting price above yesterday" — a directional/trend day cue. Similarly for prevVAL. The alerts fire on these.
- Inside today's value area = balance, outside = potential trend. Today's blue dashed VAH/VAL are the live fair-value envelope; fades back to the POC at these levels are clean mean-reversion setups in balanced sessions.
- Treat the POC as a magnet. Late-session price far from the POC often gets pulled back to it; holding above the POC is a meaningful bullish signature even before prevVAH breaks.
- Today's VAH/VAL stabilize after the first 2-3 hours; the early-session profile is necessarily noisier. Treat early-session VAH/VAL fades as lower-conviction; the second half of the session produces the cleanest reads.
- Look for confluence. A prevVAH or prevVAL that aligns with the previous day's close, prior-day high/low, or a moving average is far more reliable as a breakout level than the value area in isolation.
- On cash indices where exchange volume is published as zero, the profile is bar-count based. The shapes and POC are still useful as time-at-price proxies. Switch to futures or individual stocks for a true volume profile.
Part of the DYNA Ecosystem
Volume Profile Lite is a free indicator built with the same design standards as the DYNA premium suite. For complete trade management with automatic stop loss, break-even, trailing stops, and multi-target systems, explore the full DYNA indicator collection.
Disclaimer
This indicator is a technical analysis and educational tool only — it is not financial advice and makes no guarantee of any outcome. Past performance does not predict future results. Always do your own research and use proper position sizing and risk management.