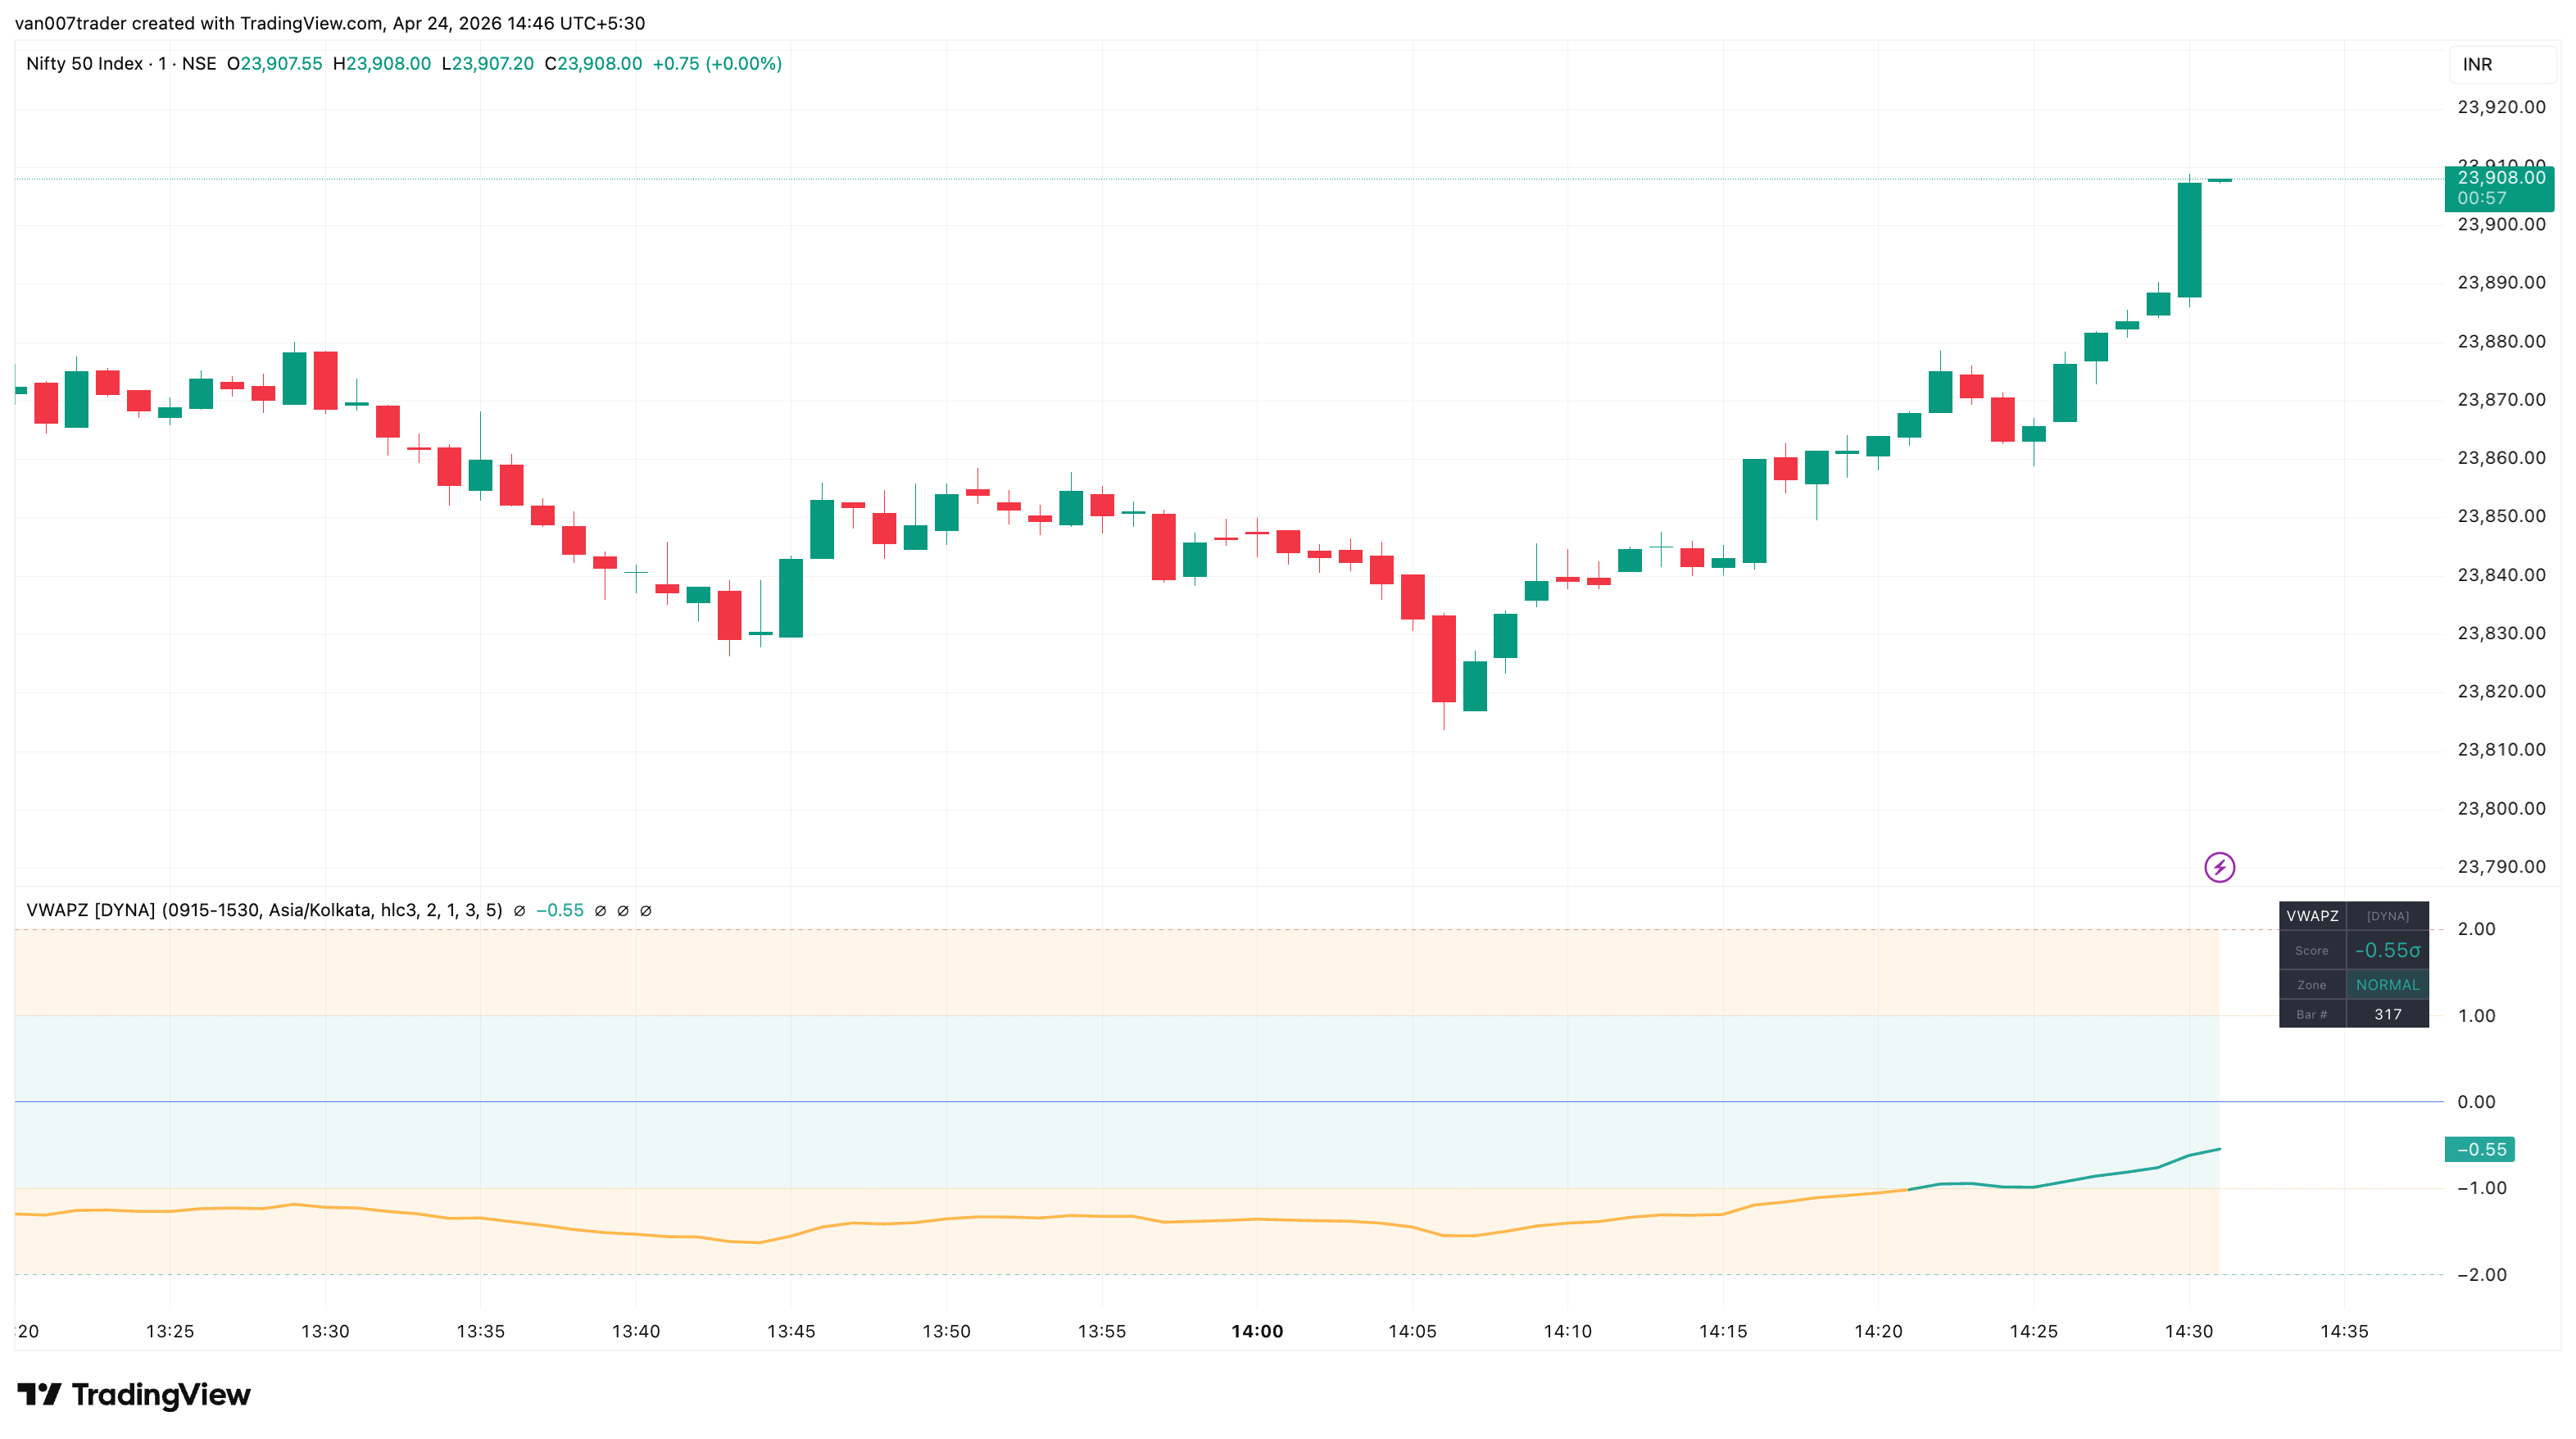
VWAP Deviation Score expresses how stretched price is from the session's VWAP as a single z-score number — the count of intraday standard deviations between the current close and the volume-weighted mean. Zero means price is sitting on VWAP. ±1 is one standard deviation away (~68% statistical envelope). ±2 is the alertable extreme (~95% envelope). Beyond ±2 is a statistically uncommon reading under a normal distribution.
The indicator lives in its own pane below price. The smoothed z-score line is colored by zone — green inside ±1σ, amber between ±1σ and ±2σ, red beyond ±2σ — so the current state is readable at a glance. Three confirmed-bar alerts cover the actionable transitions: extreme bullish stretch, extreme bearish stretch, and the return back to VWAP after an extreme reading.
Unlike rolling-window z-score indicators, this one anchors VWAP and the standard deviation to the session open. The dispersion measurement therefore reflects only today's price action, not yesterday's noise — every session starts fresh.
Key Features
- Session-Anchored Z-Score — True intraday measurement of stretch from VWAP. Resets every session, no carryover from yesterday.
- Three-Zone Coloring — Normal (green), caution (amber), extreme (red). The line color tells you the regime before you read the number.
- Configurable Thresholds — Independent caution and extreme threshold inputs (defaults ±1σ and ±2σ). Adjust per instrument volatility.
- EMA Smoothing — Optional smoothing of the raw z-score (default length 3) to suppress threshold-flicker on noisy timeframes.
- Three Alerts — Extreme bullish deviation, extreme bearish deviation, return to VWAP after an extreme. All confirmed on bar close.
- Early-Session Guard — Configurable minimum-bars filter (default 5) prevents noise alerts when intraday standard deviation has not yet stabilised.
- Compact Dashboard — Top-right table shows current z-score, zone label, and bar count since session open.
- Volume-Agnostic — Works on instruments with or without published volume. Cash indices with no published volume fall back to a flat weight automatically.
- No Repainting — Signal conditions gated on confirmed bars; once an alert has fired, the historical signal does not move.
How It Works
At the start of each session the indicator begins accumulating volume-weighted sums of the source price and the source price squared. From these it derives the session VWAP (Σ src·vol / Σ vol) and the volume-weighted variance (Σ src²·vol / Σ vol − VWAP²). The standard deviation is the square root of the variance.
The raw z-score is then (close − VWAP) / σ — the number of standard deviations between the current close and the session mean. A short EMA is applied to the raw value to produce the smoothed signal line shown on the chart.
The score is classified into three zones: normal (|z| < caution), caution (caution ≤ |z| < extreme), and extreme (|z| ≥ extreme). The line colour, the pane background, and the dashboard all reflect the current zone.
Signals fire only on confirmed (closed) bars. "Extreme bullish deviation" fires the bar the smoothed z-score crosses above the extreme threshold; "extreme bearish deviation" mirrors it on the negative side. "Return to VWAP" fires when the score crosses zero after having been beyond the extreme threshold earlier in the same session — paired with the extreme alerts, it marks the completion of a mean-reversion round trip.
Settings
Session Time (default: 0915-1530) and Timezone (default: Asia/Kolkata) define the session window that anchors the VWAP. VWAP Source (default: hlc3) sets the price used in the weighted average; hlc3 matches TradingView's built-in VWAP.
Extreme Threshold (default: 2.0σ) is the alertable line. Caution Threshold (default: 1.0σ) opens the amber zone but does not fire alerts — it is purely a visual aid for the colour band. Signal Smoothing (default: 3) is the EMA length applied to the raw z-score. Min Bars Before Signals (default: 5) suppresses signals while the early-session standard deviation is still stabilising.
The Visual toggles control the optional raw z-score line, the zone fills, the extreme background tint, and the dashboard table. The three Alert toggles enable or disable each alert independently.
Alerts
- Extreme Bullish Deviation — Fires on the bar the smoothed z-score crosses above the extreme threshold. Price is in the top tail of the intraday distribution. "VWAP Deviation Score [DYNA]: Z-score crossed above the extreme upper threshold — price stretched well above session VWAP."
- Extreme Bearish Deviation — Fires on the bar the smoothed z-score crosses below the negative extreme threshold. Mirror of the bullish case. "VWAP Deviation Score [DYNA]: Z-score crossed below the extreme lower threshold — price stretched well below session VWAP."
- Return to VWAP — Fires when the smoothed z-score crosses zero after having been beyond the extreme threshold earlier in the same session. Marks the completion of a mean-reversion round trip. "VWAP Deviation Score [DYNA]: Z-score returned to zero after an extreme deviation — mean-reversion to session VWAP confirmed."
To set up alerts: click TradingView's Alerts button, choose "VWAP Deviation Score [DYNA]" from the condition dropdown, pick one of the three alert variants, and select your notification channel.
Best Practices
- Read the line colour first, the number second. The zone tells you the regime; the exact value is for fine-tuning entries.
- Extreme readings mark the tails of the intraday distribution — a zone many traders watch for potential mean-reversion. The "Return to VWAP" alert can mark when price has traded back to the session mean.
- Tune the extreme threshold per instrument. 2σ is a good default; raise to 2.5-3σ on highly volatile small-caps or crypto, lower to 1.5σ on slow-moving instruments.
- Combine with a higher-timeframe trend filter to choose which side of an extreme reading to take. With-trend extreme readings often mark continuation pullbacks; counter-trend extremes mark exhaustion.
- Give the indicator at least 5-7 bars after session open before reading it. The minimum-bars guard suppresses alerts but the visible value can still be unstable while standard deviation is stabilising.
- On cash-index charts with no published volume, treat this as a session-anchored standardised price oscillator rather than a true volume-weighted z-score. The signal logic is unchanged; only the per-bar weighting falls back to flat.
Part of the DYNA Ecosystem
VWAP Deviation Score is a free indicator built with the same design standards as the DYNA premium suite. For complete trade management with automatic stop loss, break-even, trailing stops, and multi-target systems, explore the full DYNA indicator collection.
Disclaimer
This indicator is a technical analysis and educational tool only — it is not financial advice and makes no guarantee of any outcome. Past performance does not predict future results. Always do your own research and use proper position sizing and risk management.